1. Introduction
In my latest project, I wanted to find out what Real-Time Intelligence in Microsoft Fabric can do in practice. As an example, I picked the German power grid. The data never stands still: sometimes wind and solar cover more than the entire demand, sometimes the electricity price drops below zero, and the grid frequency moves around 50 Hz second by second.
My goal was to load this data into Fabric continuously, make it visible in a Real-Time Dashboard and use Activator to send automatic email alerts when certain things happen, such as negative electricity prices. As a final step, I wanted to put an AI component on top: a data agent you can ask questions about the power grid in plain language.
2. The architecture
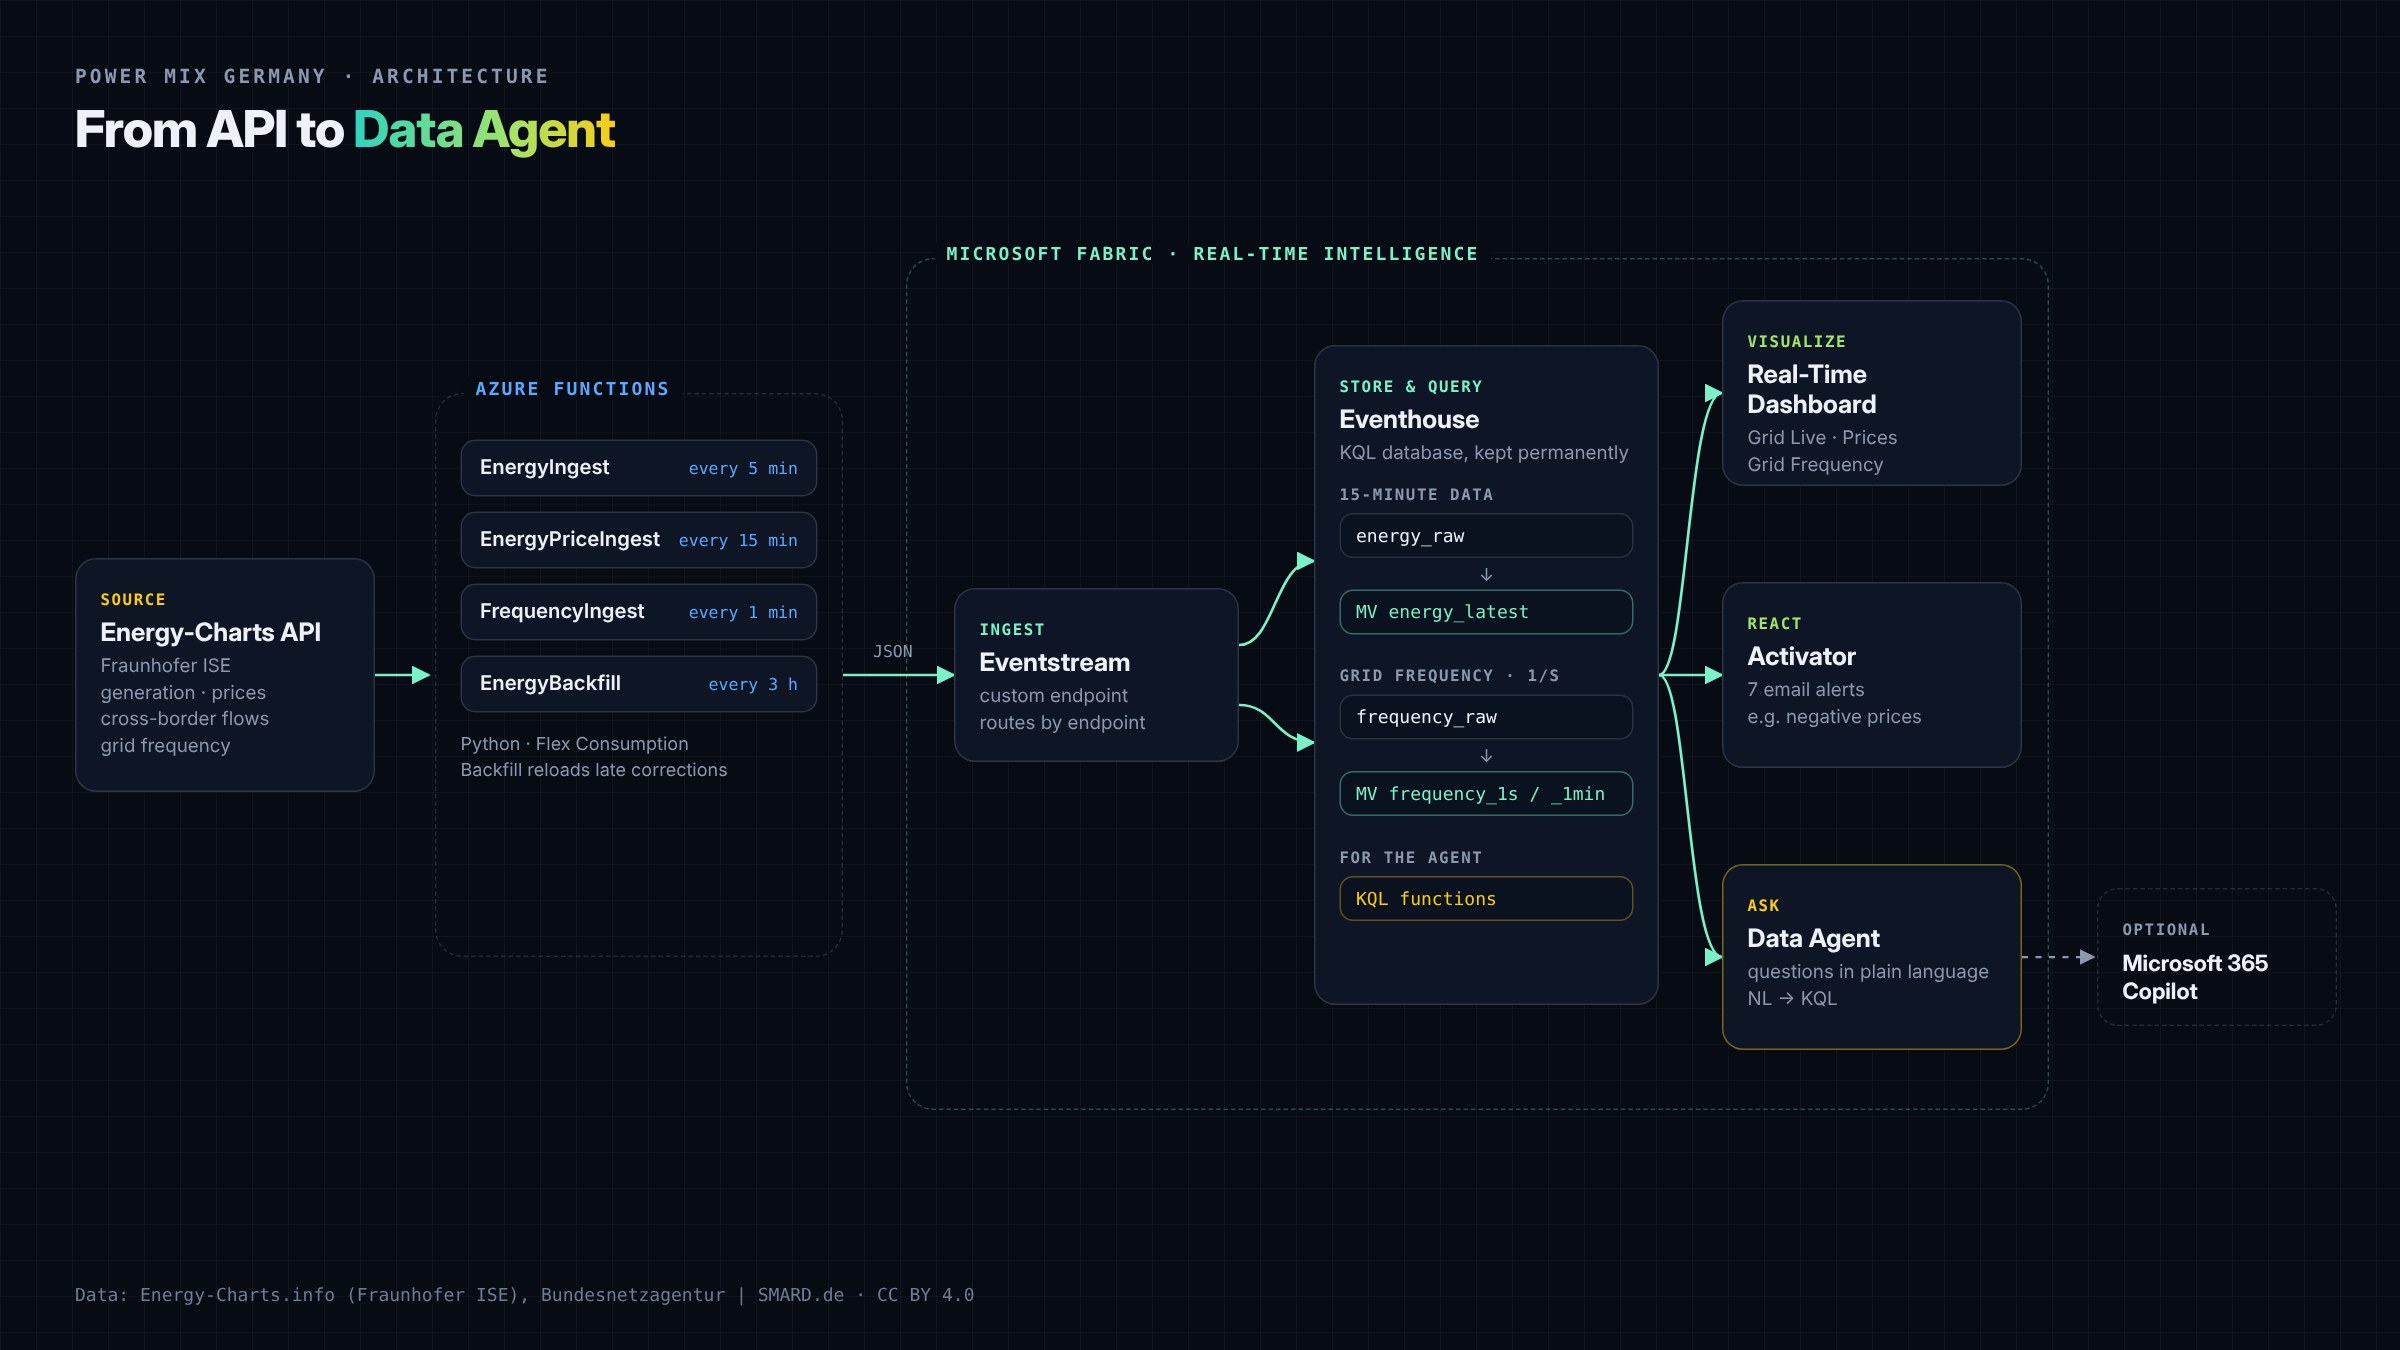
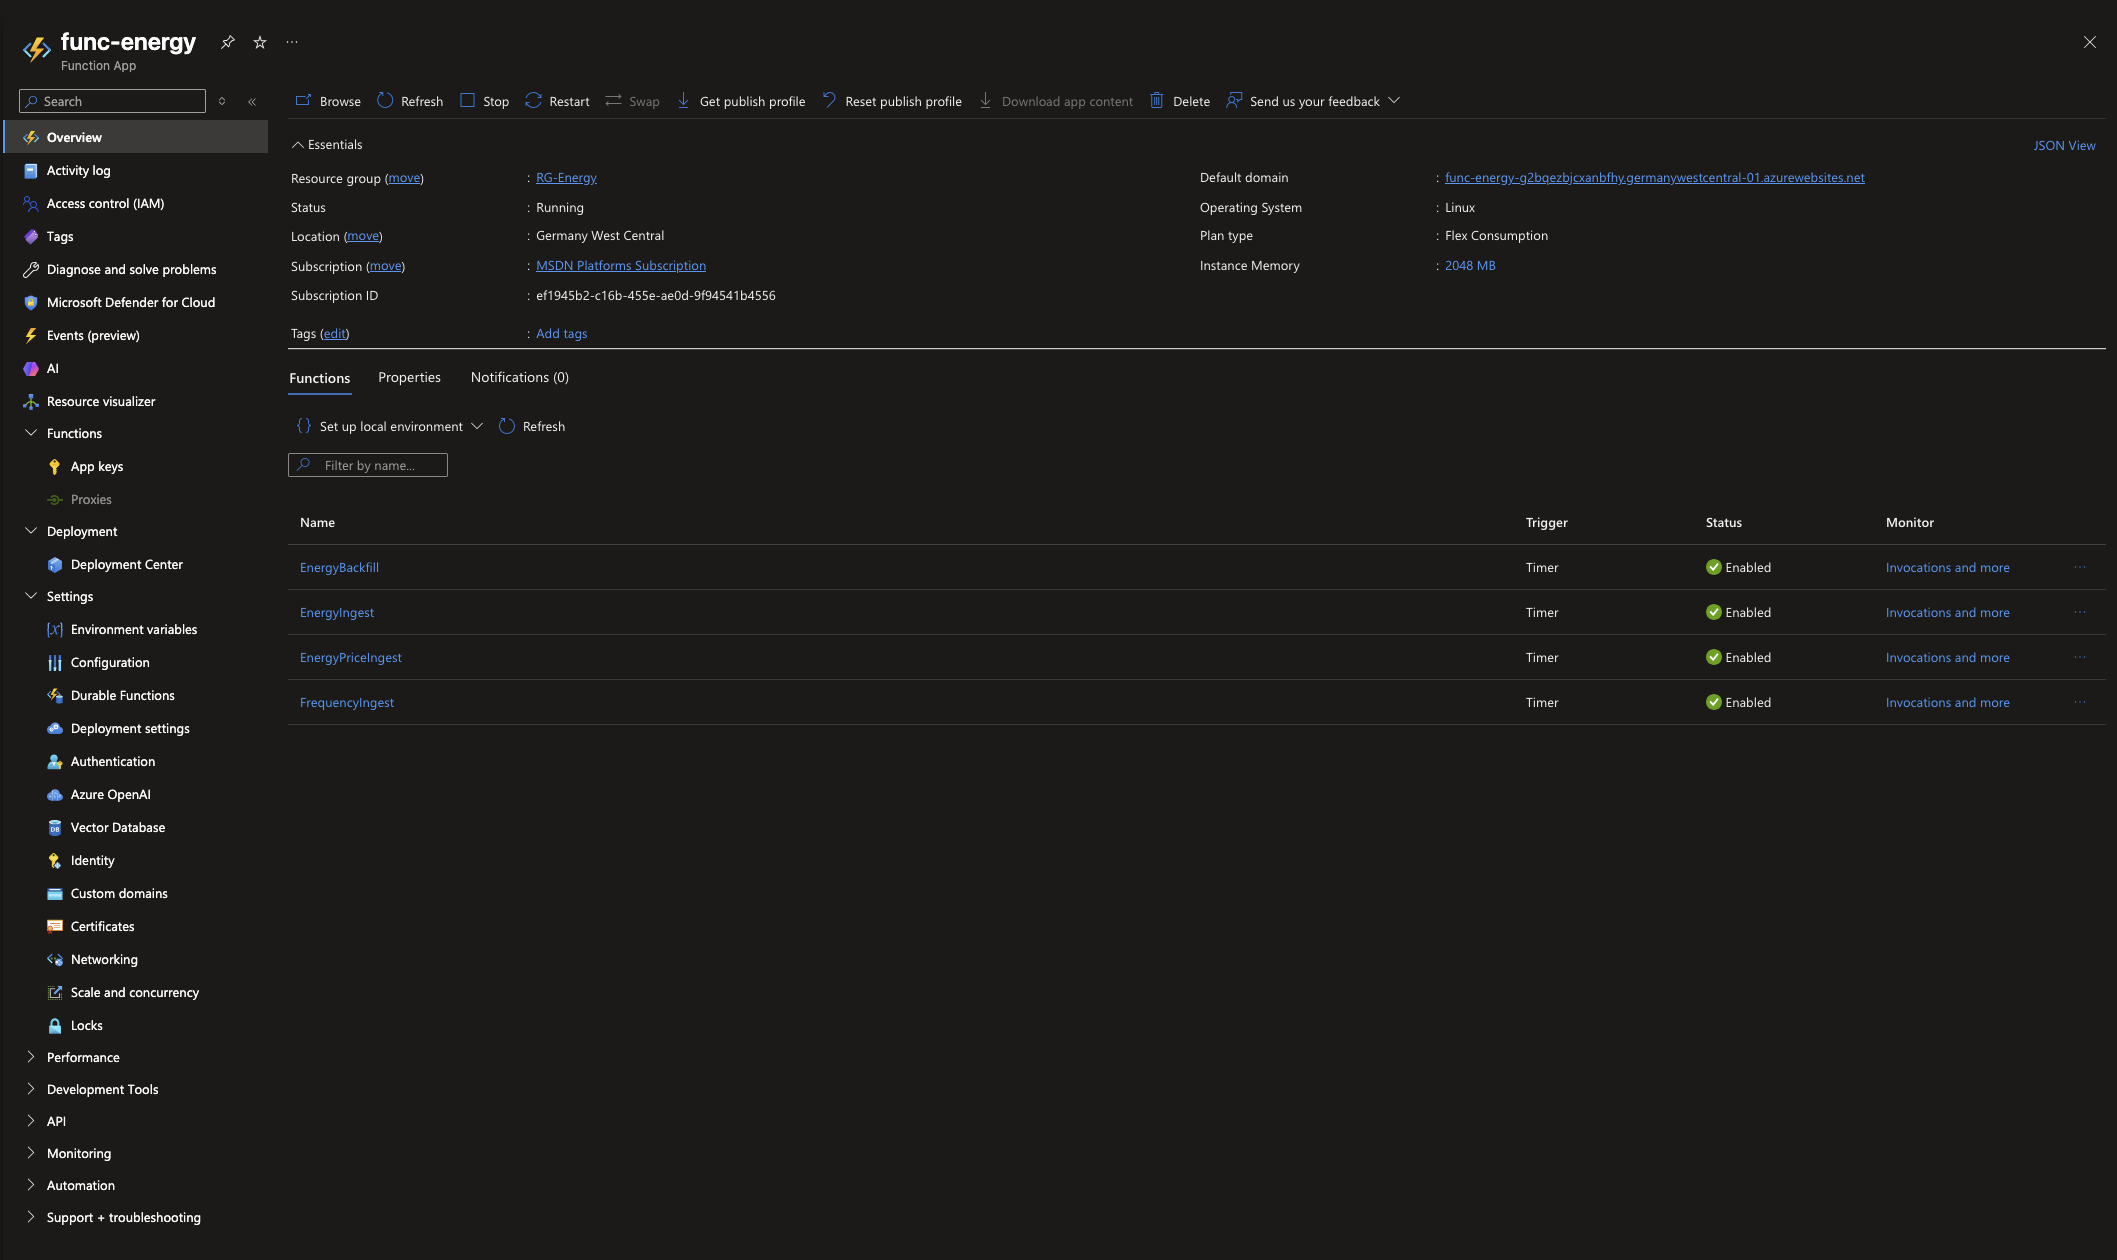
The data comes from the Energy-Charts API by Fraunhofer ISE. It’s free and doesn’t require an account. Four Azure Functions query the API on a schedule: power generation every five minutes, electricity prices every 15 minutes and grid frequency every minute. A fourth function reloads the last few days every three hours, because the source often corrects its values after the fact.
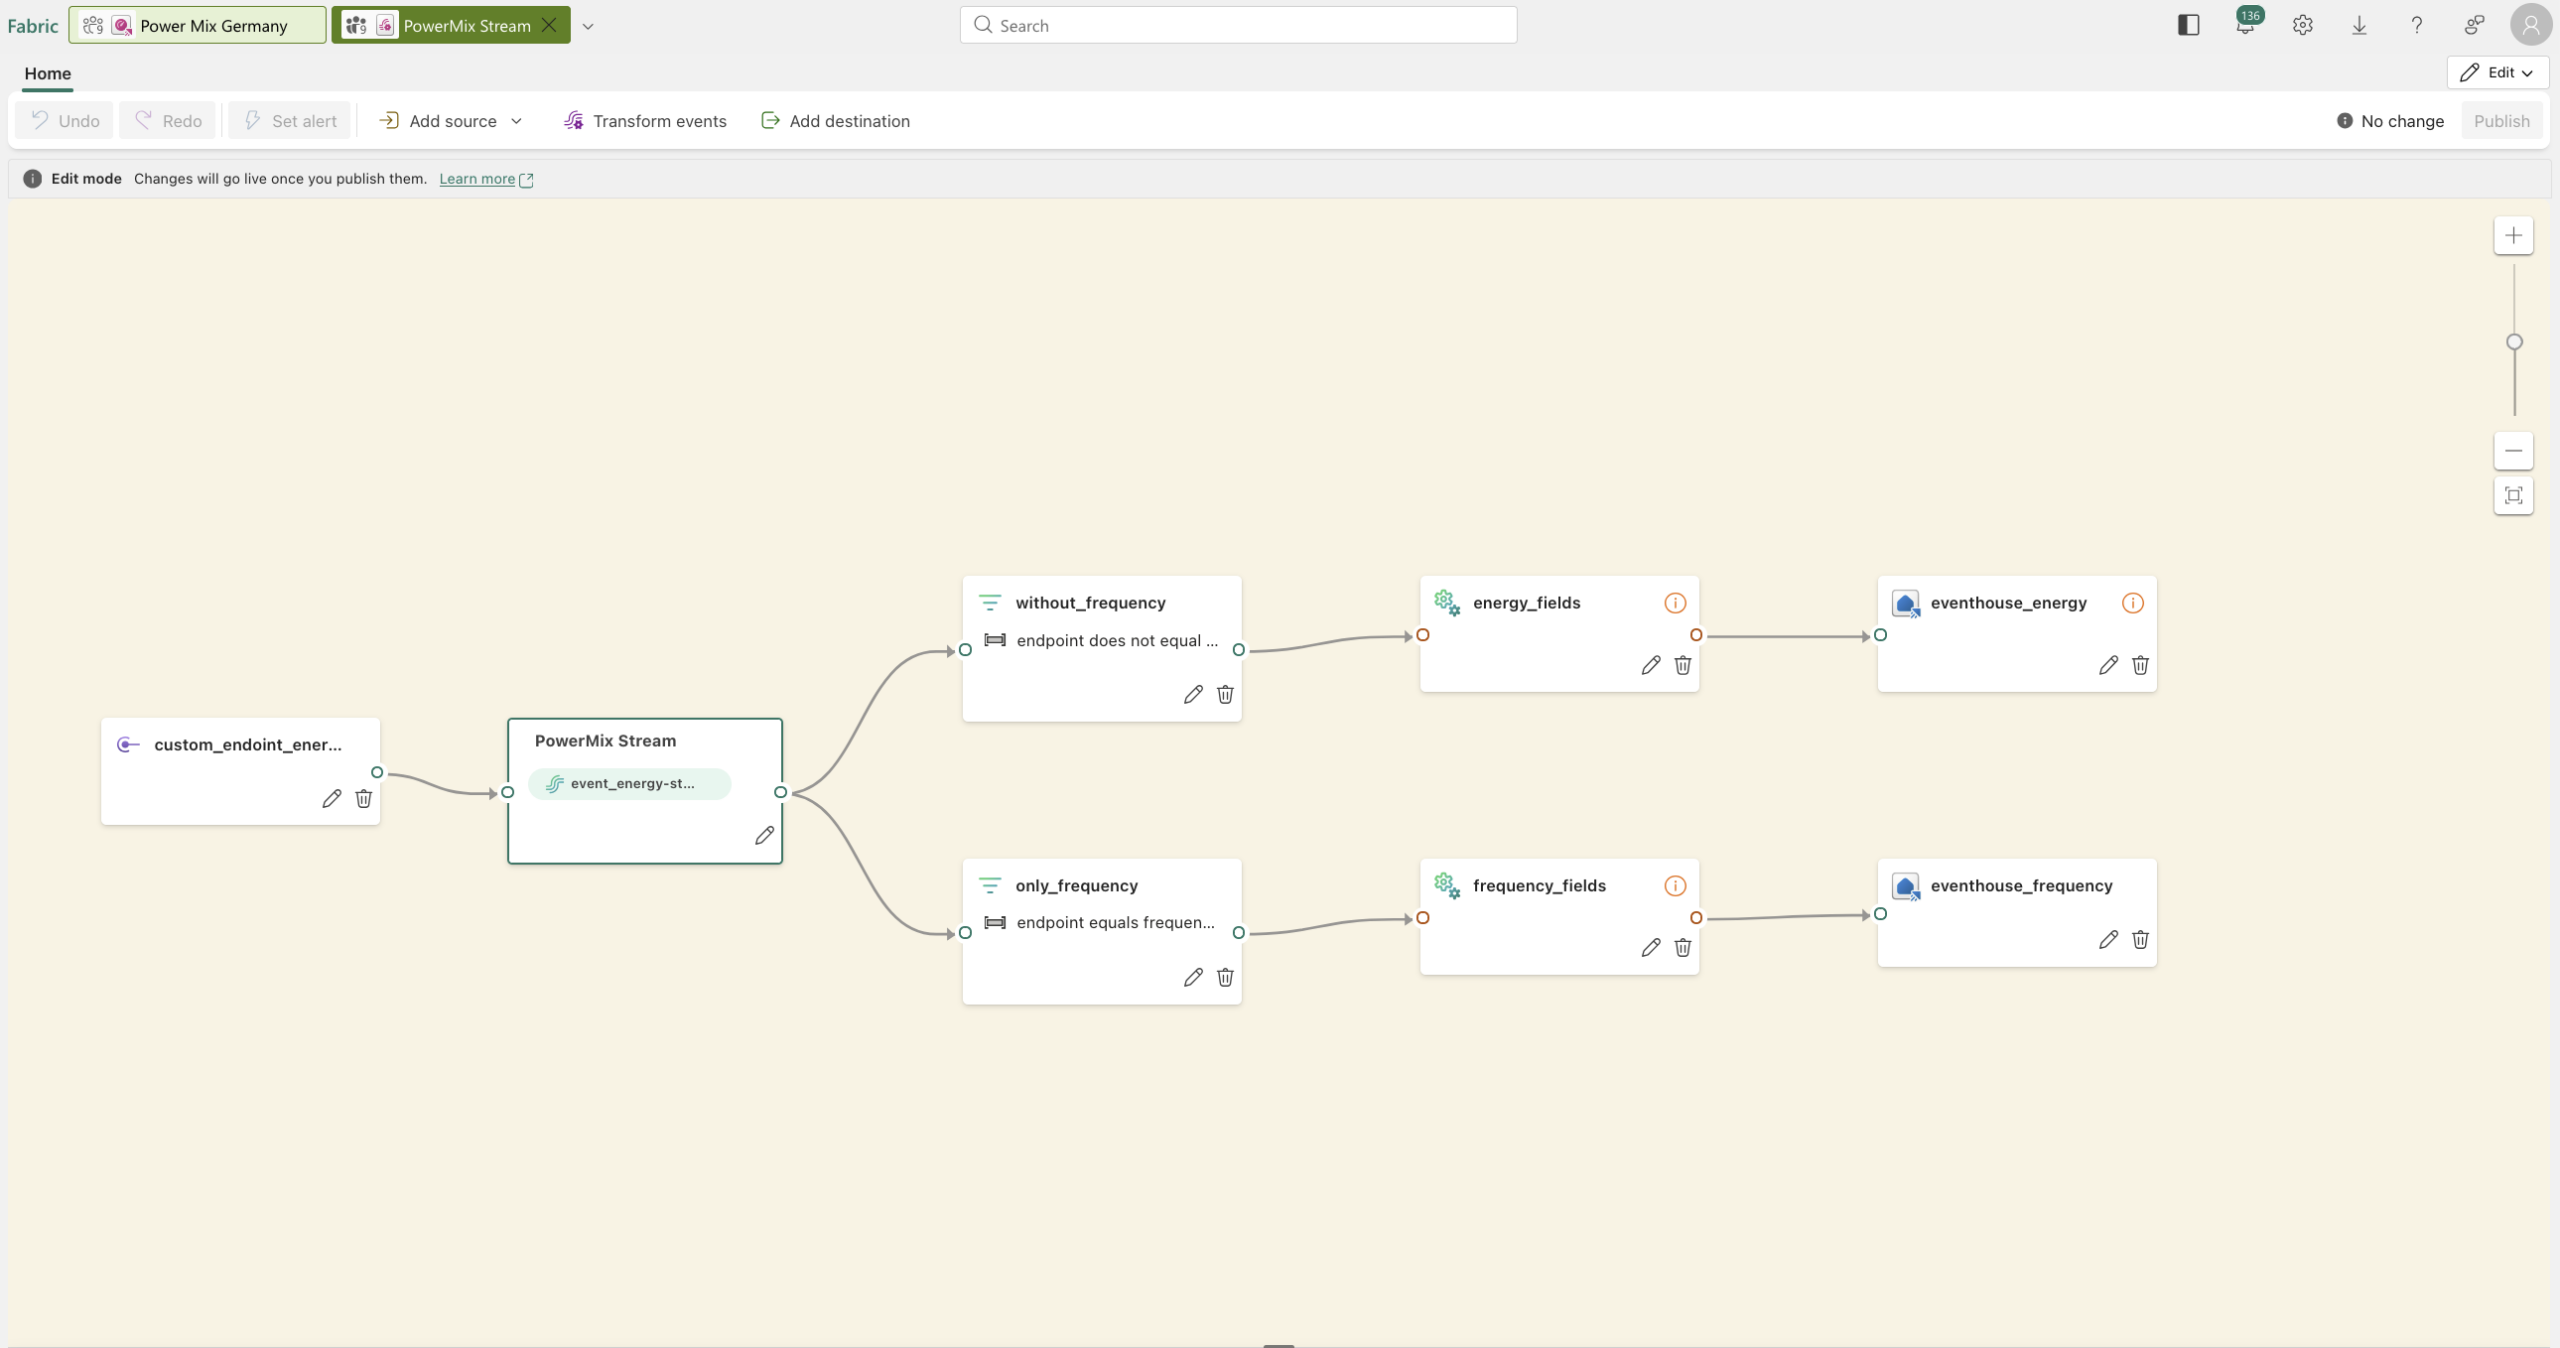
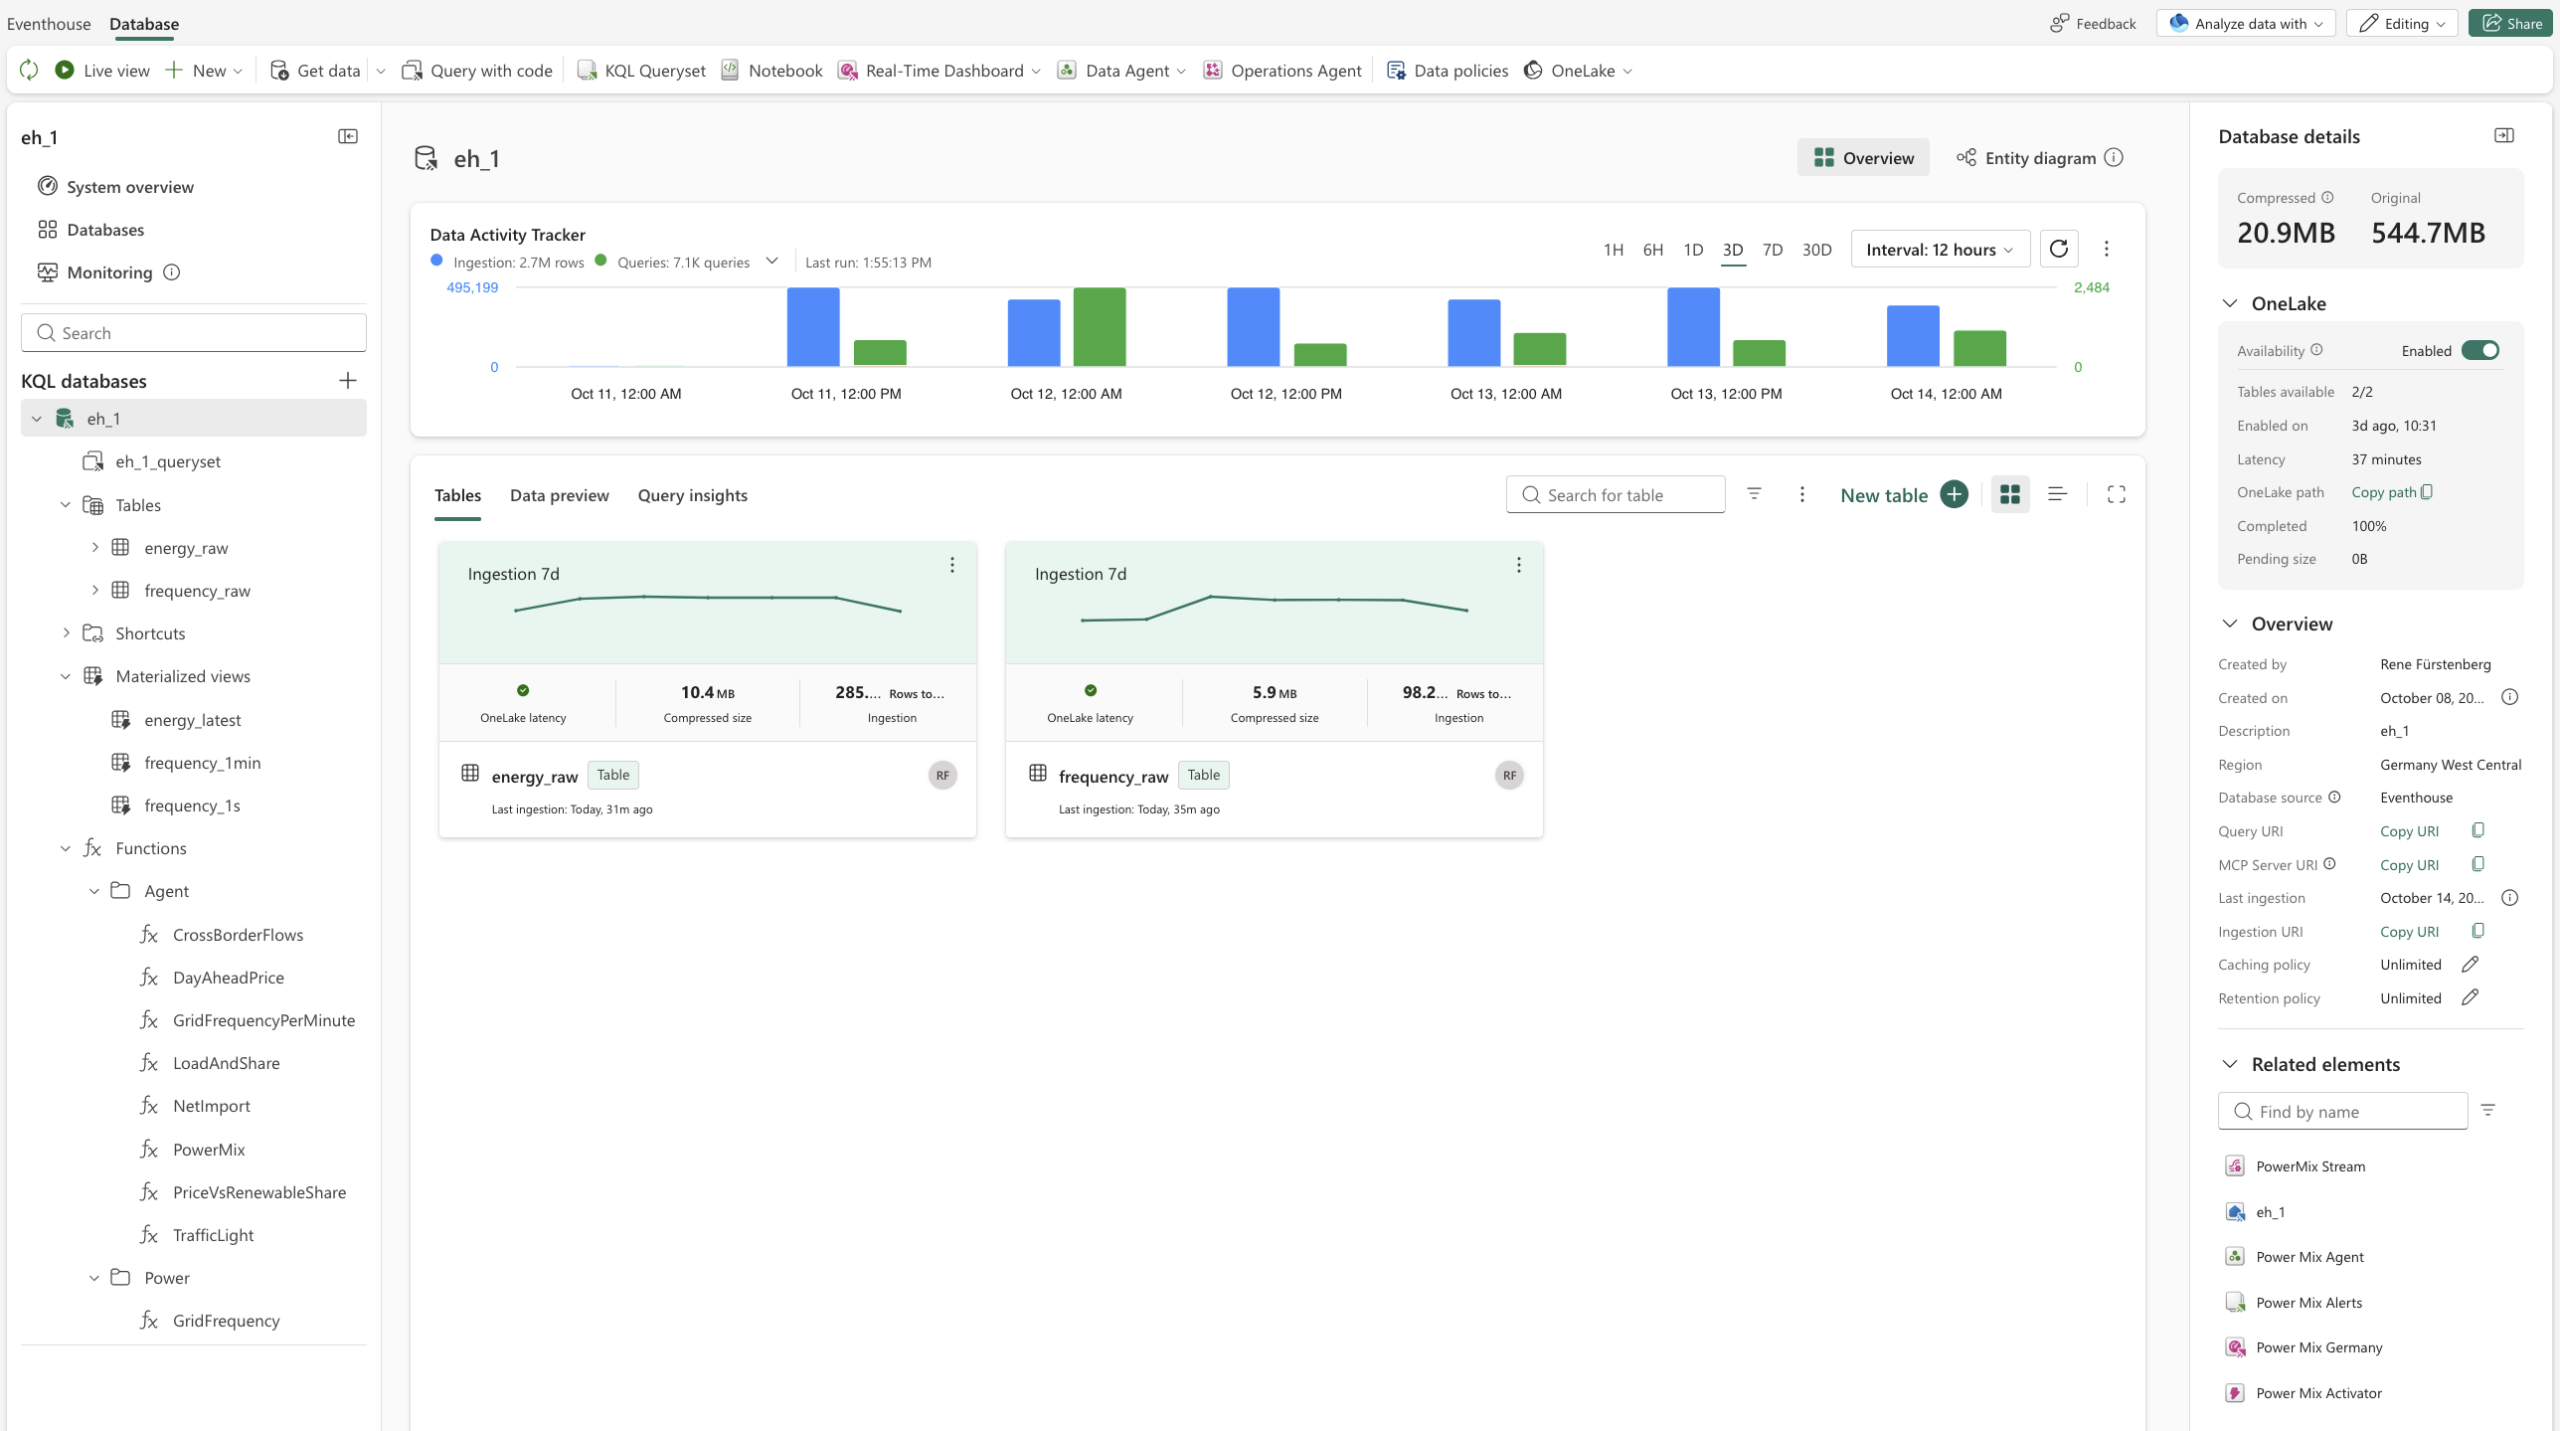
The functions send the data to an Eventstream in Fabric. It routes the events into two tables in an Eventhouse: one for the 15-minute values and one for the grid frequency, with one value per second. Materialized views make sure only the latest version of each value is used.
Three things sit on top of the Eventhouse: a Real-Time Dashboard with three pages, Activator with seven email alerts, and a data agent that answers questions through a set of KQL functions.
You’ll find the complete code, all KQL queries and the Fabric items in my GitHub repo.
Repo: real-time-intelligence-project-energy
3. Prerequisites
- Azure subscription for the Function App. I use the Flex Consumption plan, and the costs are low.
- Fabric capacity: Eventstream, Eventhouse, the dashboard and Activator also run on a trial capacity. For the data agent, however, you need a paid F capacity (F2 or higher).
- Tenant settings: data agents and the Copilot/AI features have to be enabled by a Fabric admin.
- For development: VS Code, Python and Azure Functions Core Tools.
- Optional: a GitHub repo if you want to version the Fabric items through Git integration, like I did.
4. From API to dashboard
4.1 The Azure Functions
To fetch the data, I created a Function App in Python. It runs four functions with timer triggers, each on its own schedule. They call the Energy-Charts API and split the response into individual events: one event per value, all with the same flat structure. Here the example.
{ "endpoint": "public_power", "ts": "2026-10-11T09:00:00Z", "series_id": "solar",
  "value": 31250.4, "unit": "MW", "generated_at": "2026-10-11T09:30:12Z" }
This has a big advantage: whether it’s solar power, electricity prices or grid frequency, everything arrives in the same format. New data series don’t need a schema change. The events go to Fabric over the Event Hubs protocol, and the connection string is stored in the Function App settings.
4.2 The Eventstream
In Fabric, an Eventstream receives the data through a custom endpoint. There, I split the stream into two paths: the grid frequency, with one value per second, goes into its own table, and everything else goes into a second one. With “Manage fields,” I convert the timestamps to DateTime and the values to numbers.
One pitfall: “Manage fields” has no Boolean type. The is_forecast field therefore arrives as text, and Fabric shows a schema warning. The data still loads correctly, because the Eventhouse converts the value itself.
4.3 The Eventhouse
In the Eventhouse, I keep all data permanently in two raw tables. Data is only appended, never overwritten. That matters because the source often corrects its values hours later. To always show the current state anyway, a materialized view keeps only the latest version of each value per point in time:
energy_raw
| summarize arg_max(generated_at, value, unit, series_name, is_forecast)
    by endpoint, country, series_id, ts
The dashboard, the alerts and the data agent all read from this view. For the grid frequency, there are additional views with values per second and per minute, so that analyses over several weeks stay fast.
4.4 KQL queries
All analyses are written in KQL. I tested them first in the query editor of the KQL database and then put them directly into the dashboard tiles. There’s a separate queryset only for the alerts, because Activator rules are created from a queryset. More on that in chapter 5.
KQL is really pleasant for time series. One example, the current electricity price in ct/kWh:
energy_latest
| where endpoint == "price" and ts <= now()
| top 1 by ts desc
| project Price_ct_kWh = round(value / 10, 2),
          Time = datetime_utc_to_local(ts, "Europe/Berlin")
The data is stored in UTC, but everything is shown in German time, which is why datetime_utc_to_local shows up in almost every query.
All queries are in the repo in the Fabric/kql folder, sorted by purpose: setting up the Eventhouse, the three dashboard pages, the alerts and the functions for the data agent.
4.5 The Real-Time Dashboard
The queries turned into a Real-Time Dashboard with three pages:
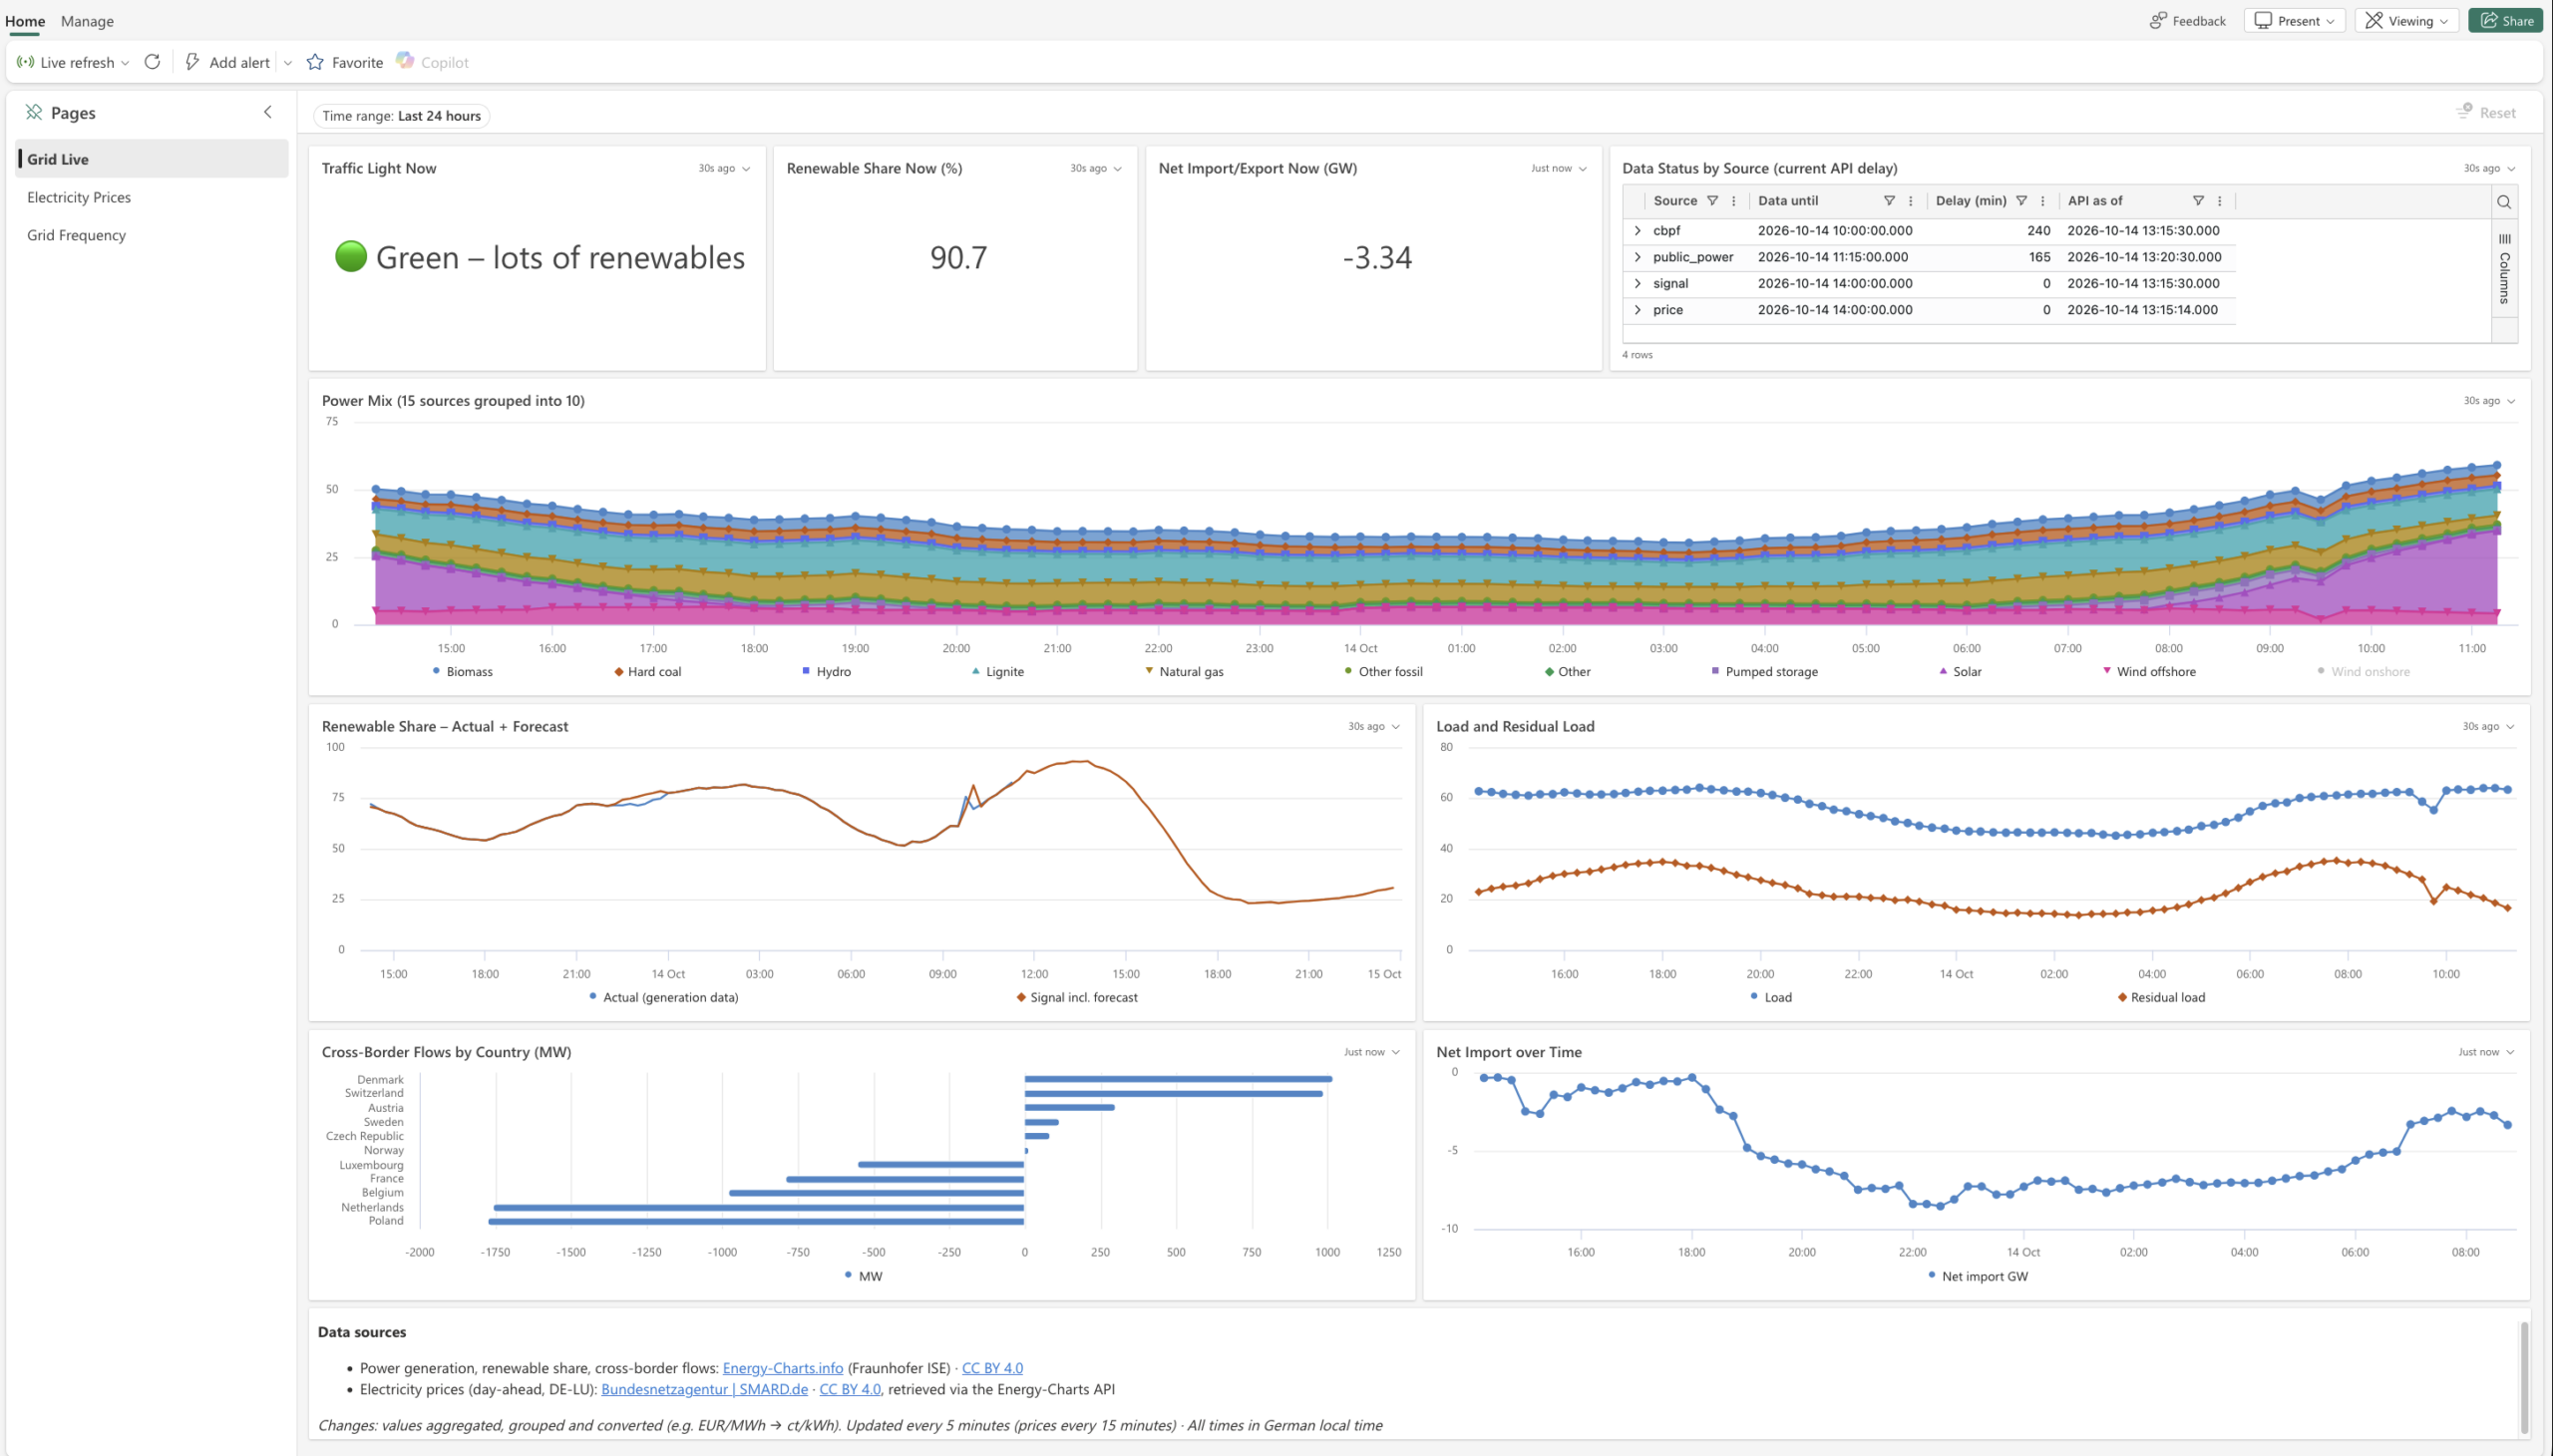
- Grid Live: power mix, traffic light, load and cross-border flows
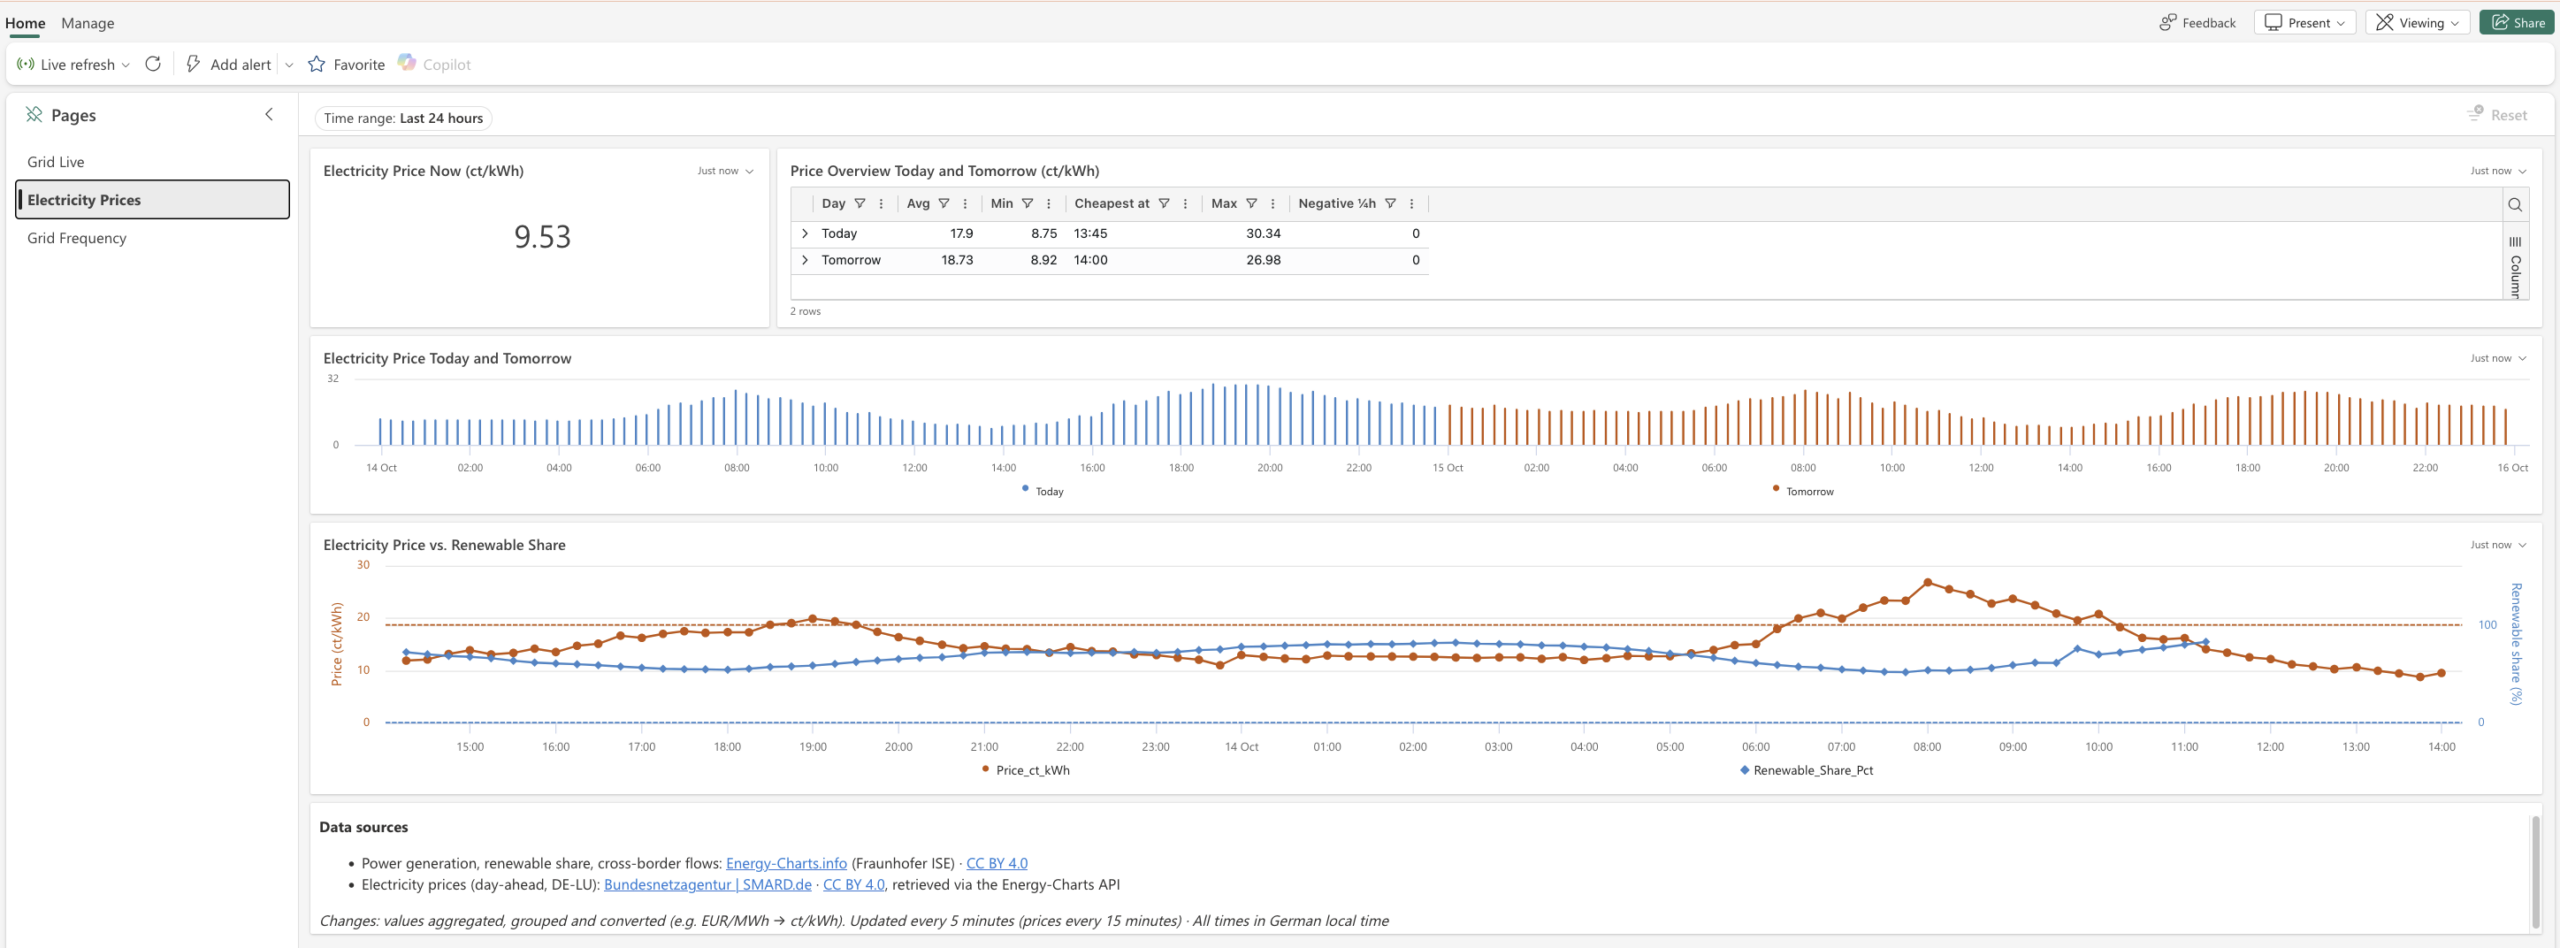
- Electricity Prices: day-ahead prices for today and tomorrow
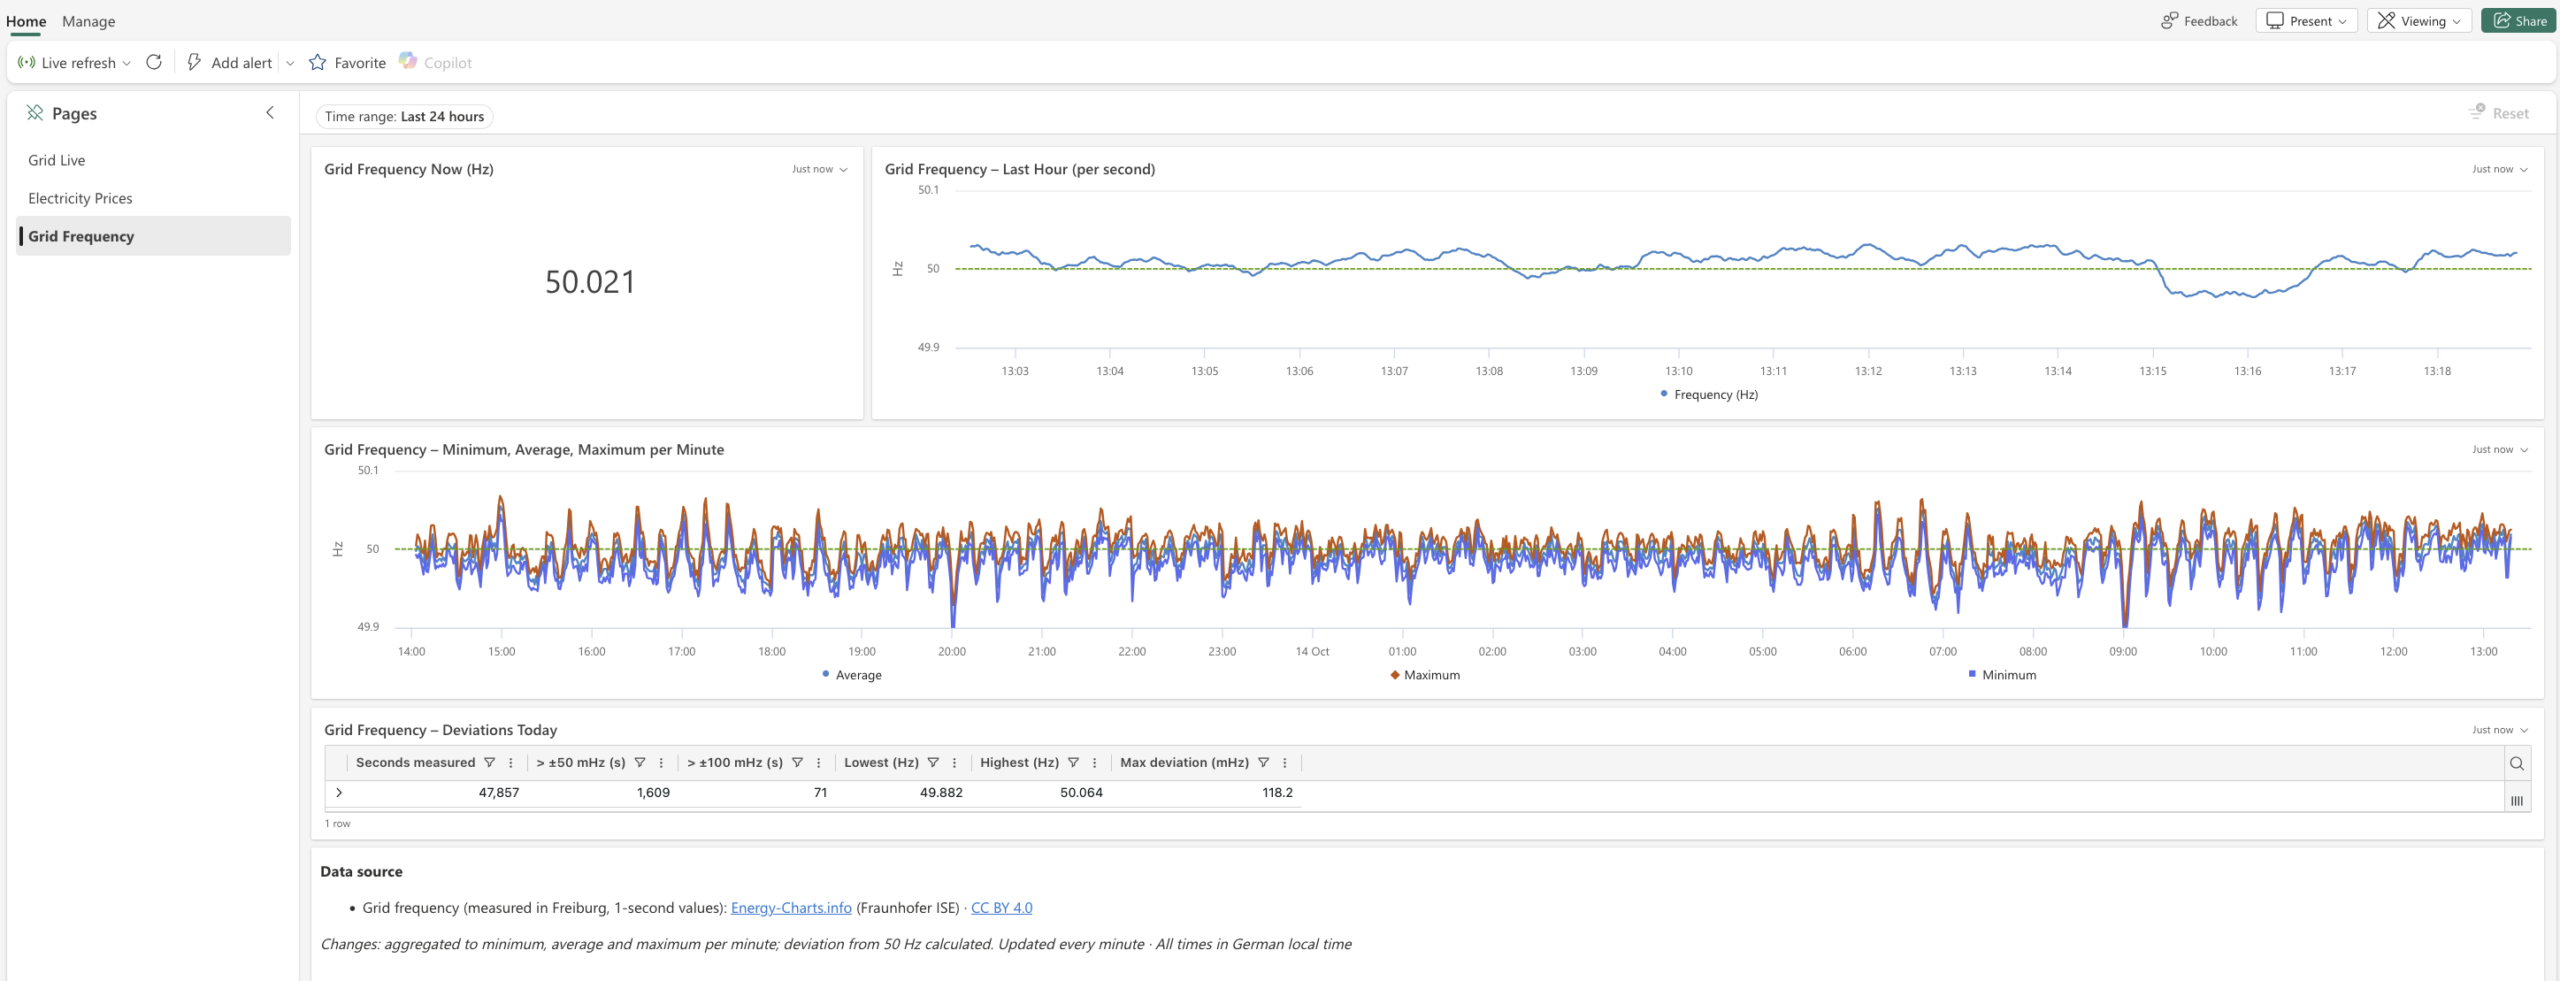
- Grid Frequency: grid frequency second by second
Each tile is its own KQL query, and the dashboard refreshes automatically.
One detail I only noticed while testing: in the cross-border flows tile, Sweden suddenly showed 0. It was actually 3 MW, which rounds to 0.00 GW. Since then, the tile shows megawatts.
Below are some screenshots.
-
- The four Azure Functions
-
- The Eventstream splits the data into two tables
-
- Raw tables and materialized views in the Eventhouse
-
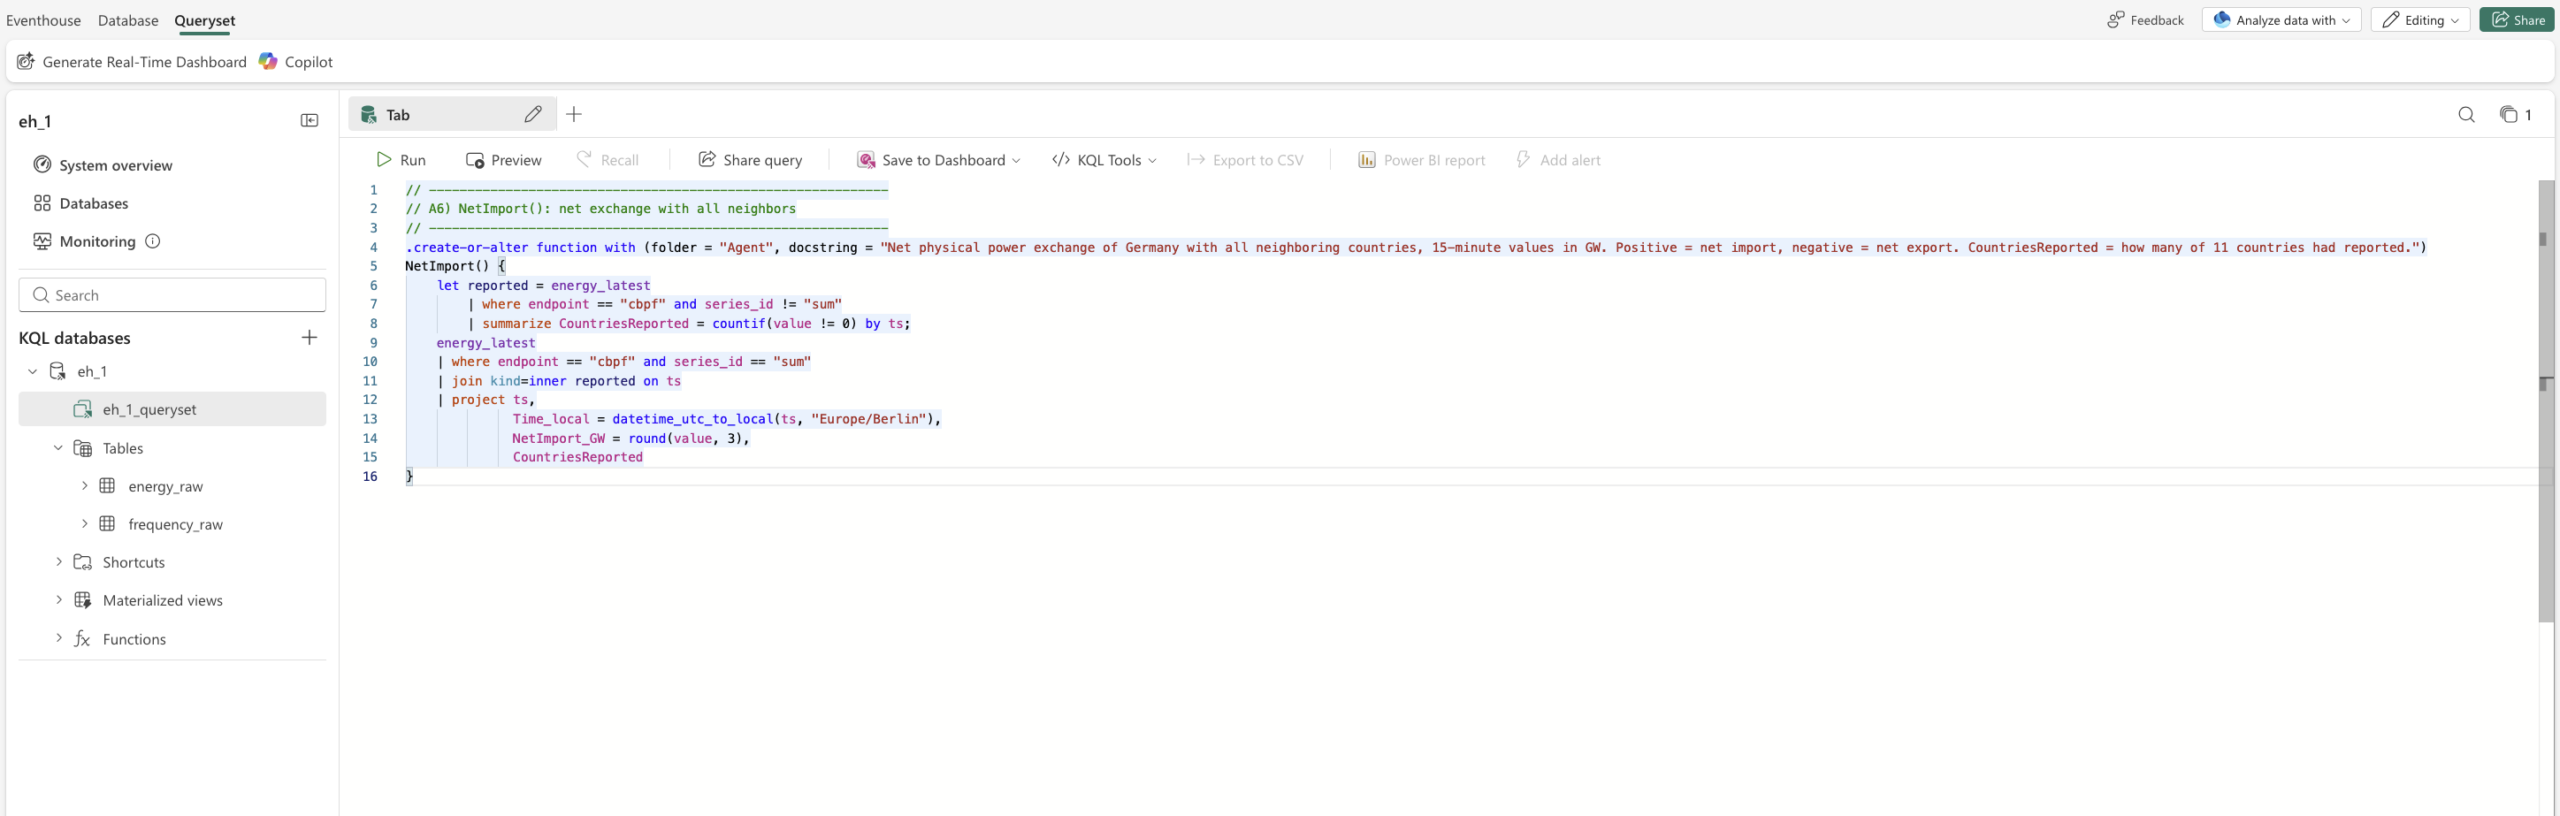
- A KQL query in the queryset
-
- Dashboard page “Electricity Prices”
-
- Dashboard page “Grid Live”
-
- Dashboard page “Grid Frequency”
5. Activator: Fabric reacts on its own
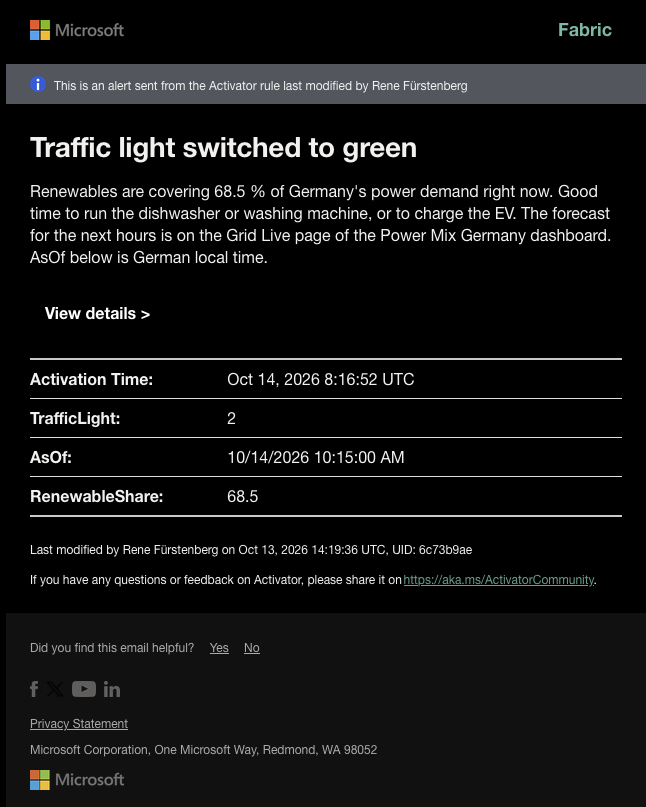
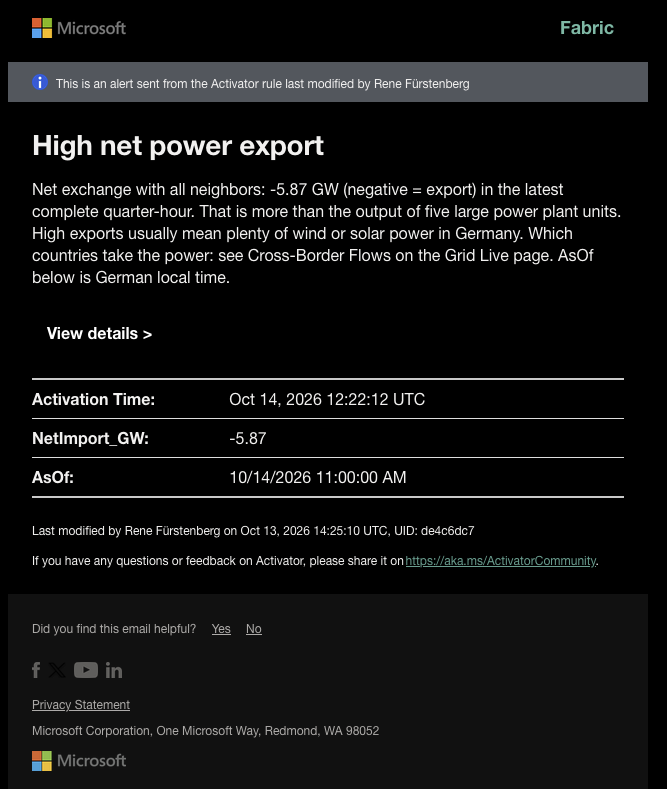
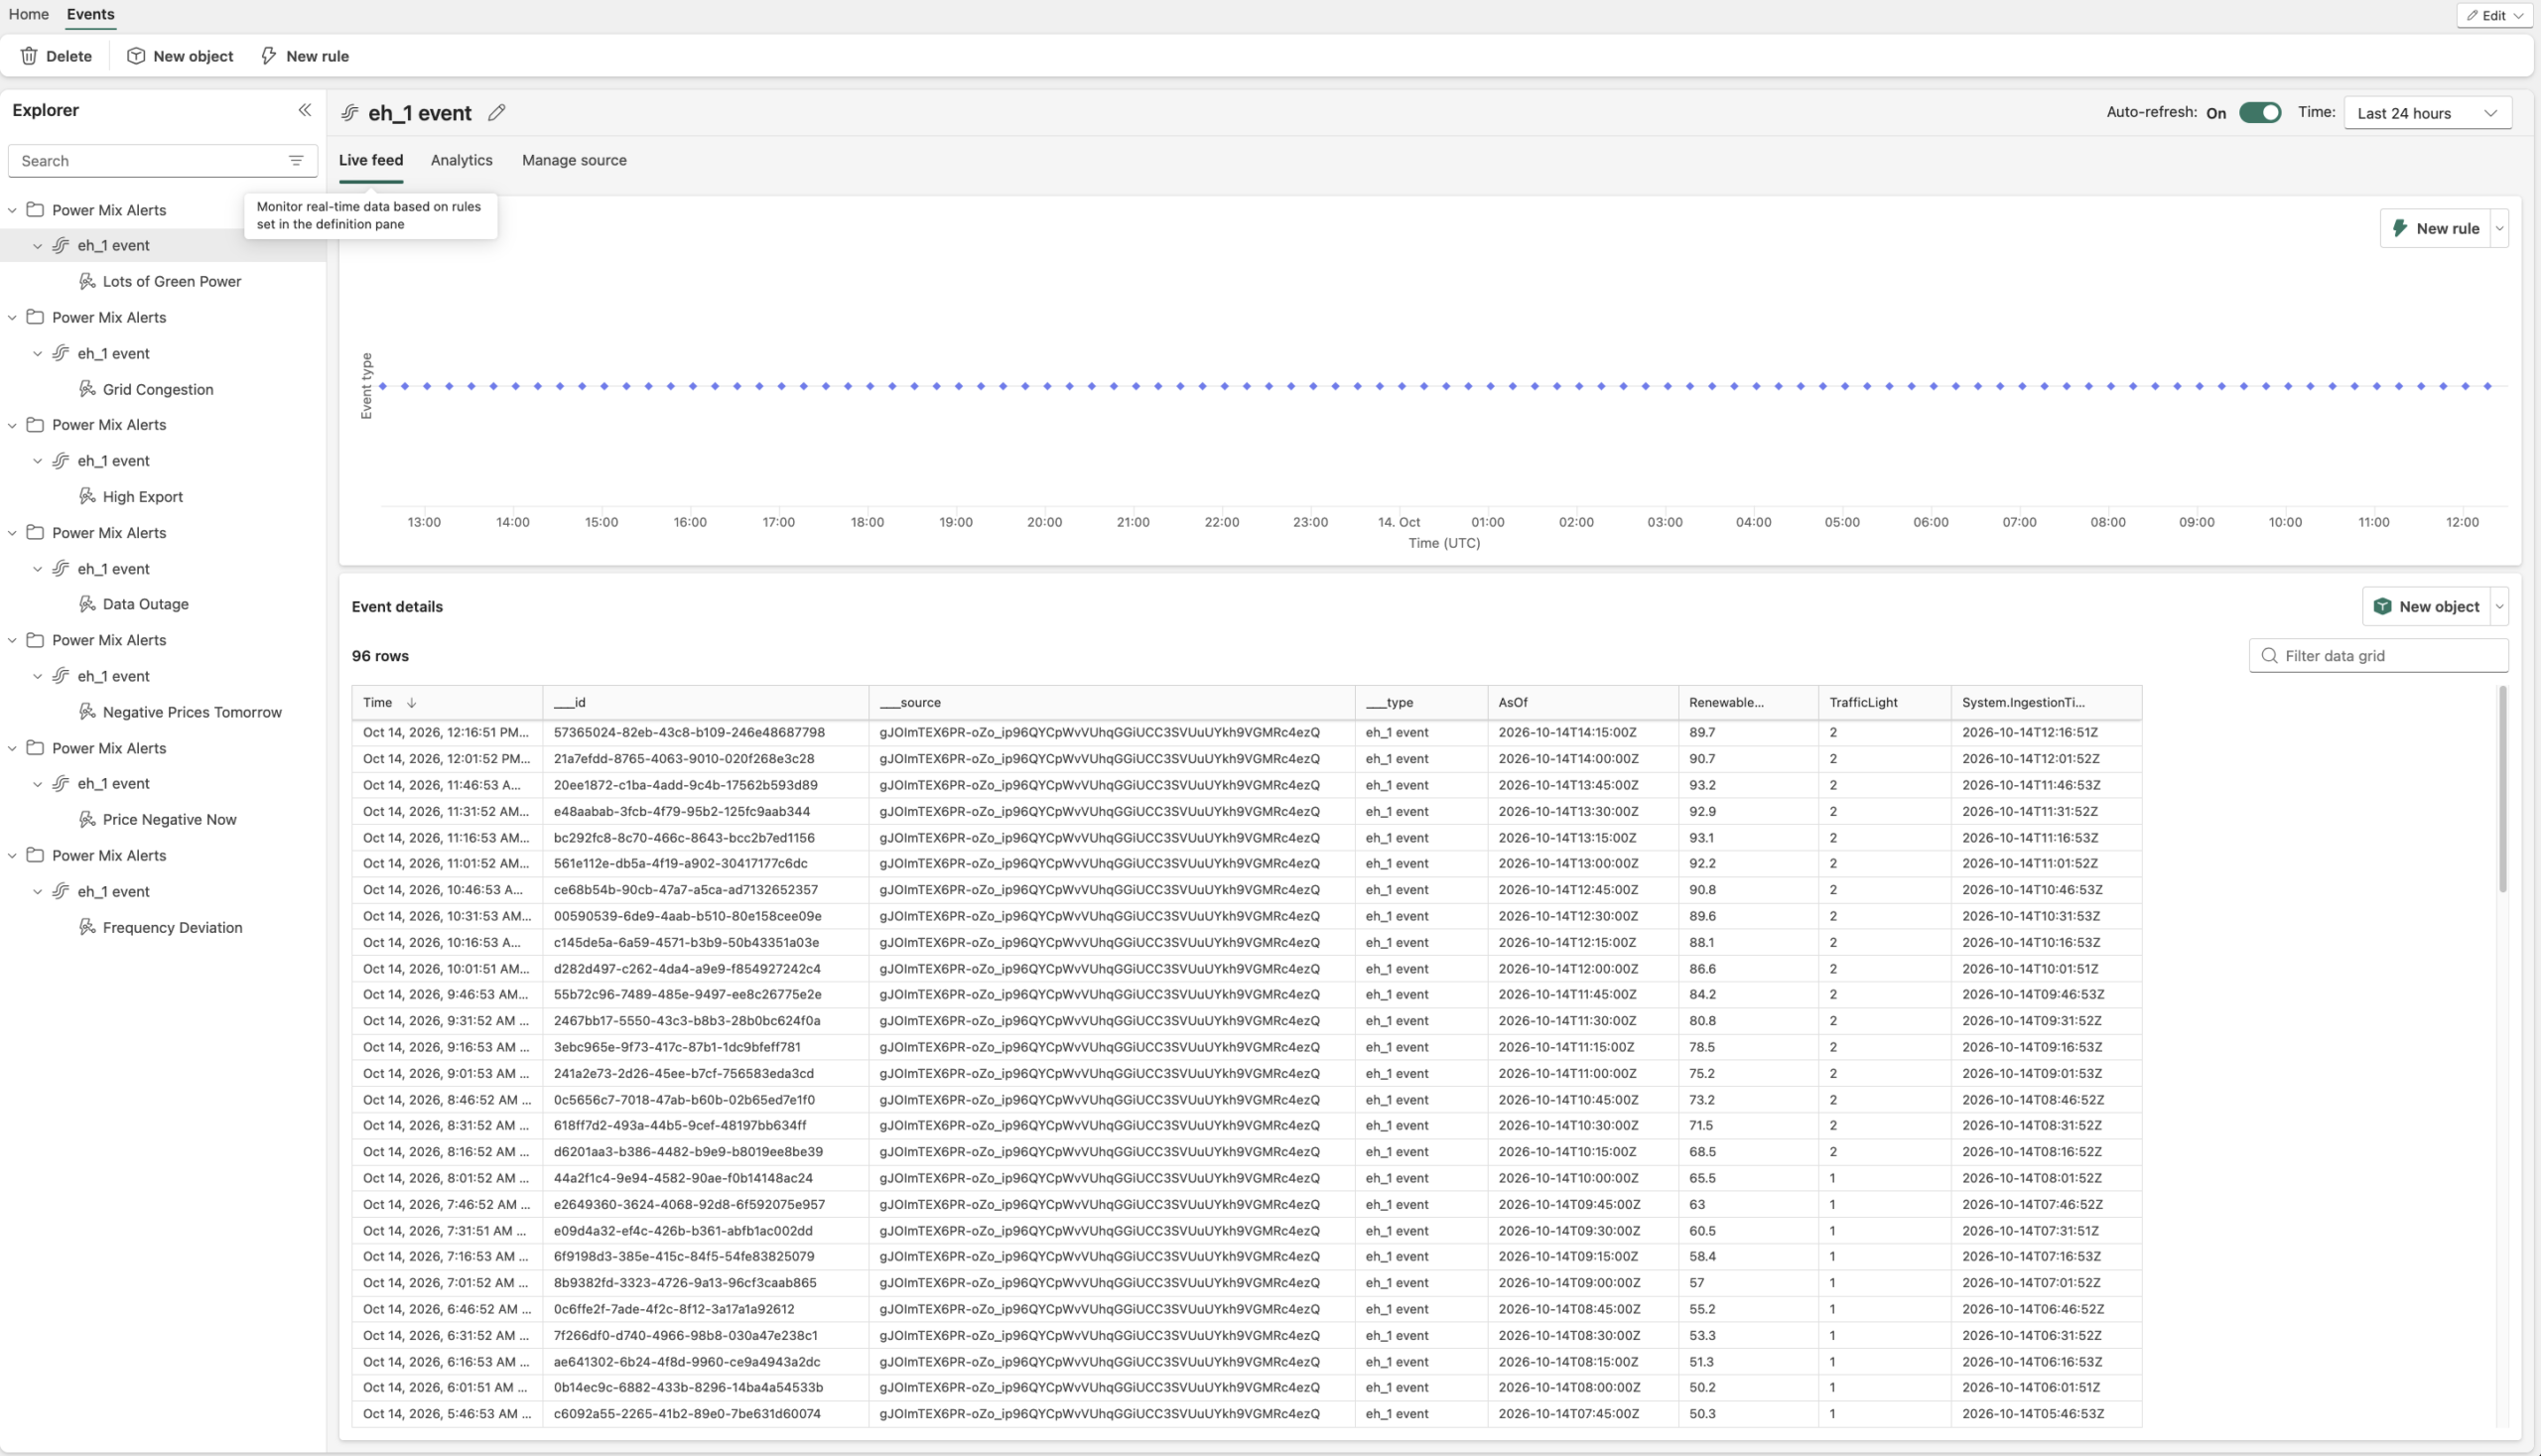
A dashboard only helps if someone looks at it. Activator turns this around: Fabric watches the data itself and lets you know when something specific happens. I set up seven rules that send me an email:
| Rule | Fires when … |
|---|---|
| Lots of Green Power | the traffic light switches to green |
| Grid Congestion | the traffic light reports grid congestion |
| High Export | Germany exports more than 5 GW |
| Negative Prices Tomorrow | tomorrow’s auction contains negative prices |
| Price Negative Now | the current electricity price drops below zero |
| Frequency Deviation | the grid frequency is more than 100 mHz away from 50 Hz |
| Data Outage | no new data has arrived for 30 minutes |
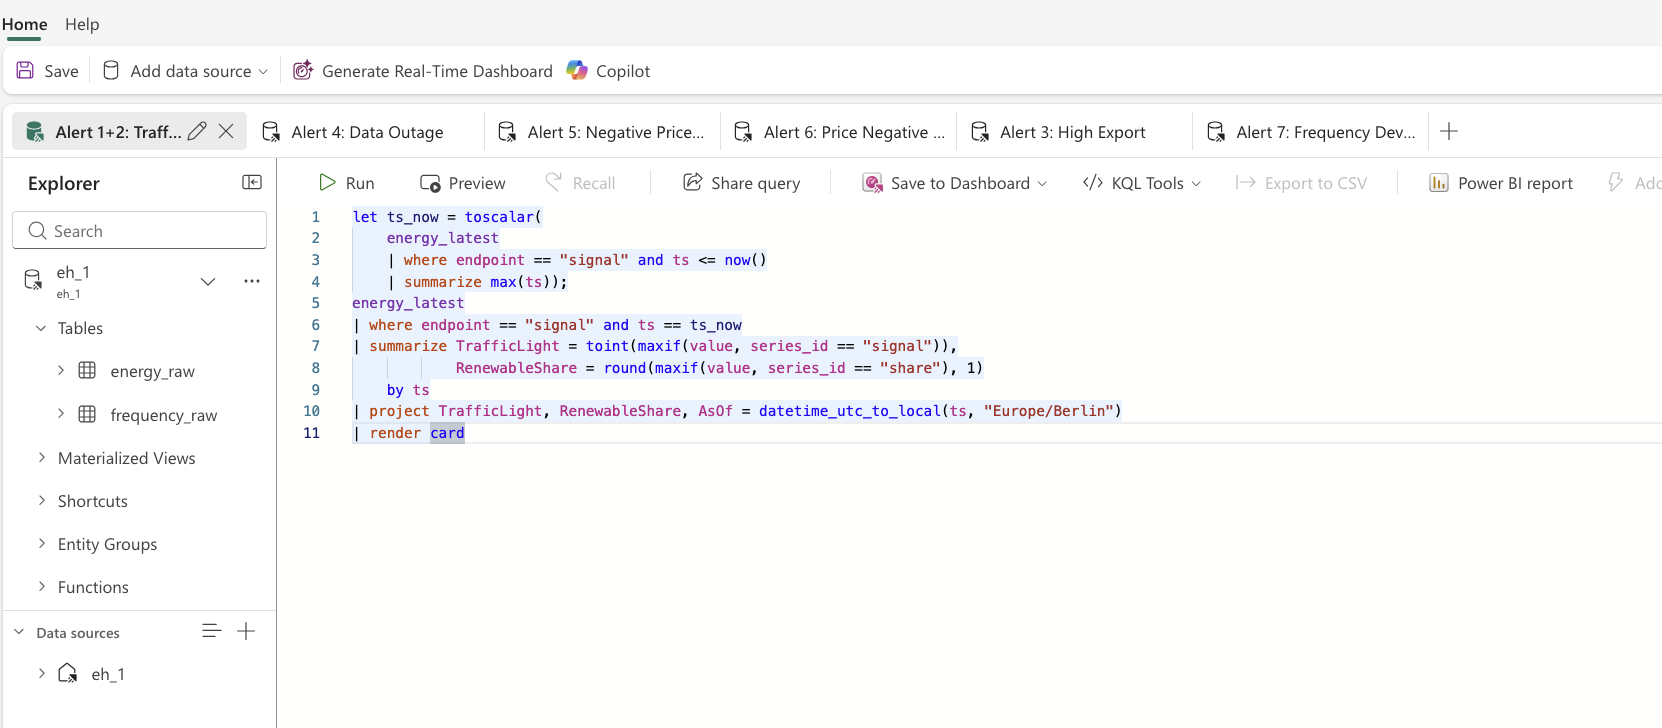
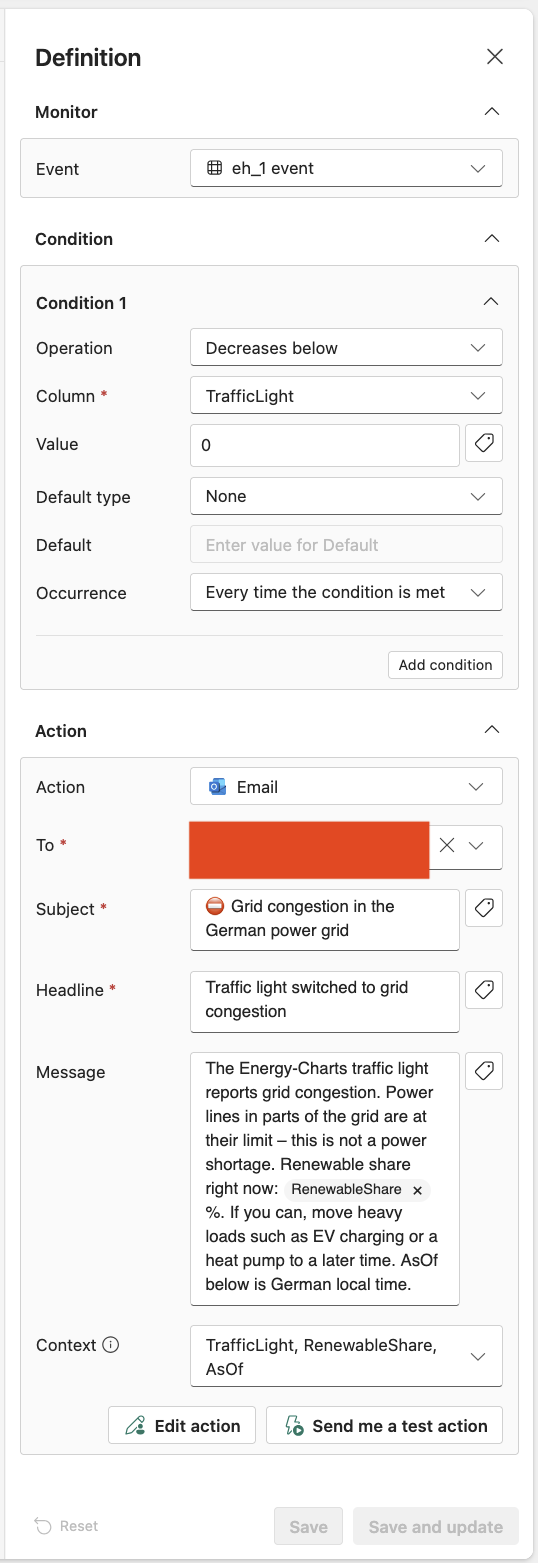
Each rule is based on a KQL query in a queryset. The query returns exactly one row with the current values. Activator runs it at a fixed interval and checks a condition, for example “value increases above 1”. So that not every run sends an email, a rule only fires when the value crosses the threshold.
Two things I learned while setting it up:
- Values in the email: columns from the query have to be inserted into the text as dynamic fields. Just typing
@Columndoesn’t work, it shows up literally in the email. - Timestamps: date values appear in the text in ISO format with a “Z” for UTC, even when the value is German time. That’s why I only show them in the table below the text.
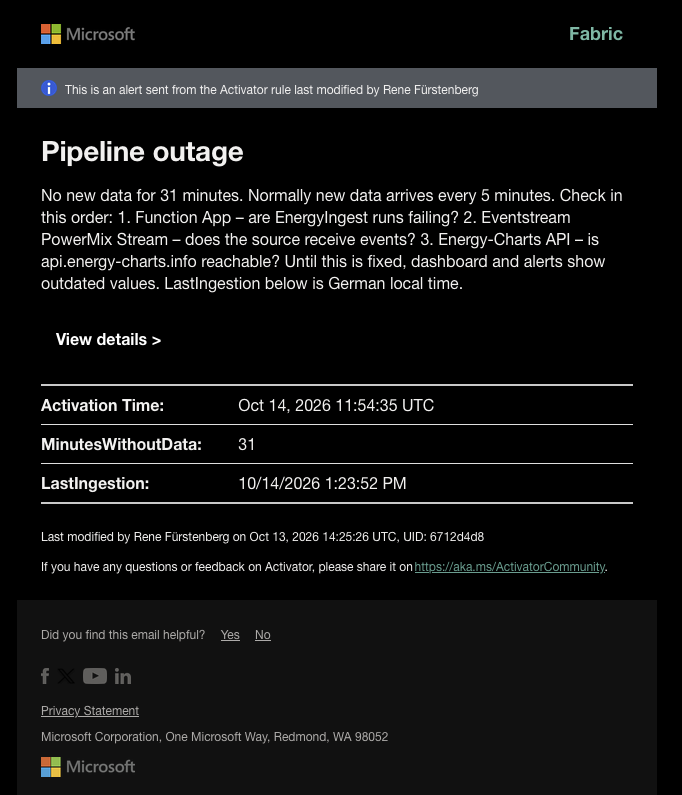
How useful this is became clear sooner than expected: while I was writing this article, I got the “Pipeline outage” email. A quick query in the Eventhouse showed that no data had arrived for more than 30 minutes, from any source. A look at the API gave the answer: “503 Service Unavailable.” My pipeline was fine, the source was down. From the email to the cause took only a few minutes.
As an example, here is the query behind the “Data Outage” alert. It calculates how many minutes have passed since data last arrived:
energy_raw
| where ingestion_time() > ago(1d)
| summarize LastIngestionUtc = max(ingestion_time())
| project MinutesWithoutData = datetime_diff("minute", now(), LastIngestionUtc),
          LastIngestion = datetime_utc_to_local(LastIngestionUtc, "Europe/Berlin")
| render card
The rule fires as soon as MinutesWithoutData rises above 30. The last line, render card, matters: only if the query ends as a card does Activator offer the option to check the value on every run.
Here are a few more screenshots of the rules and the email alerts.
-
- Each rule is based on a KQL query
-
- A rule definition – condition and email
-
- The traffic light switches to green – MAIL
-
- Germany exports more than 5 GW – MAIL
-
- The alert reports a real outage – MAIL
-
- Activator Overview
6. The data agent: questions in plain language
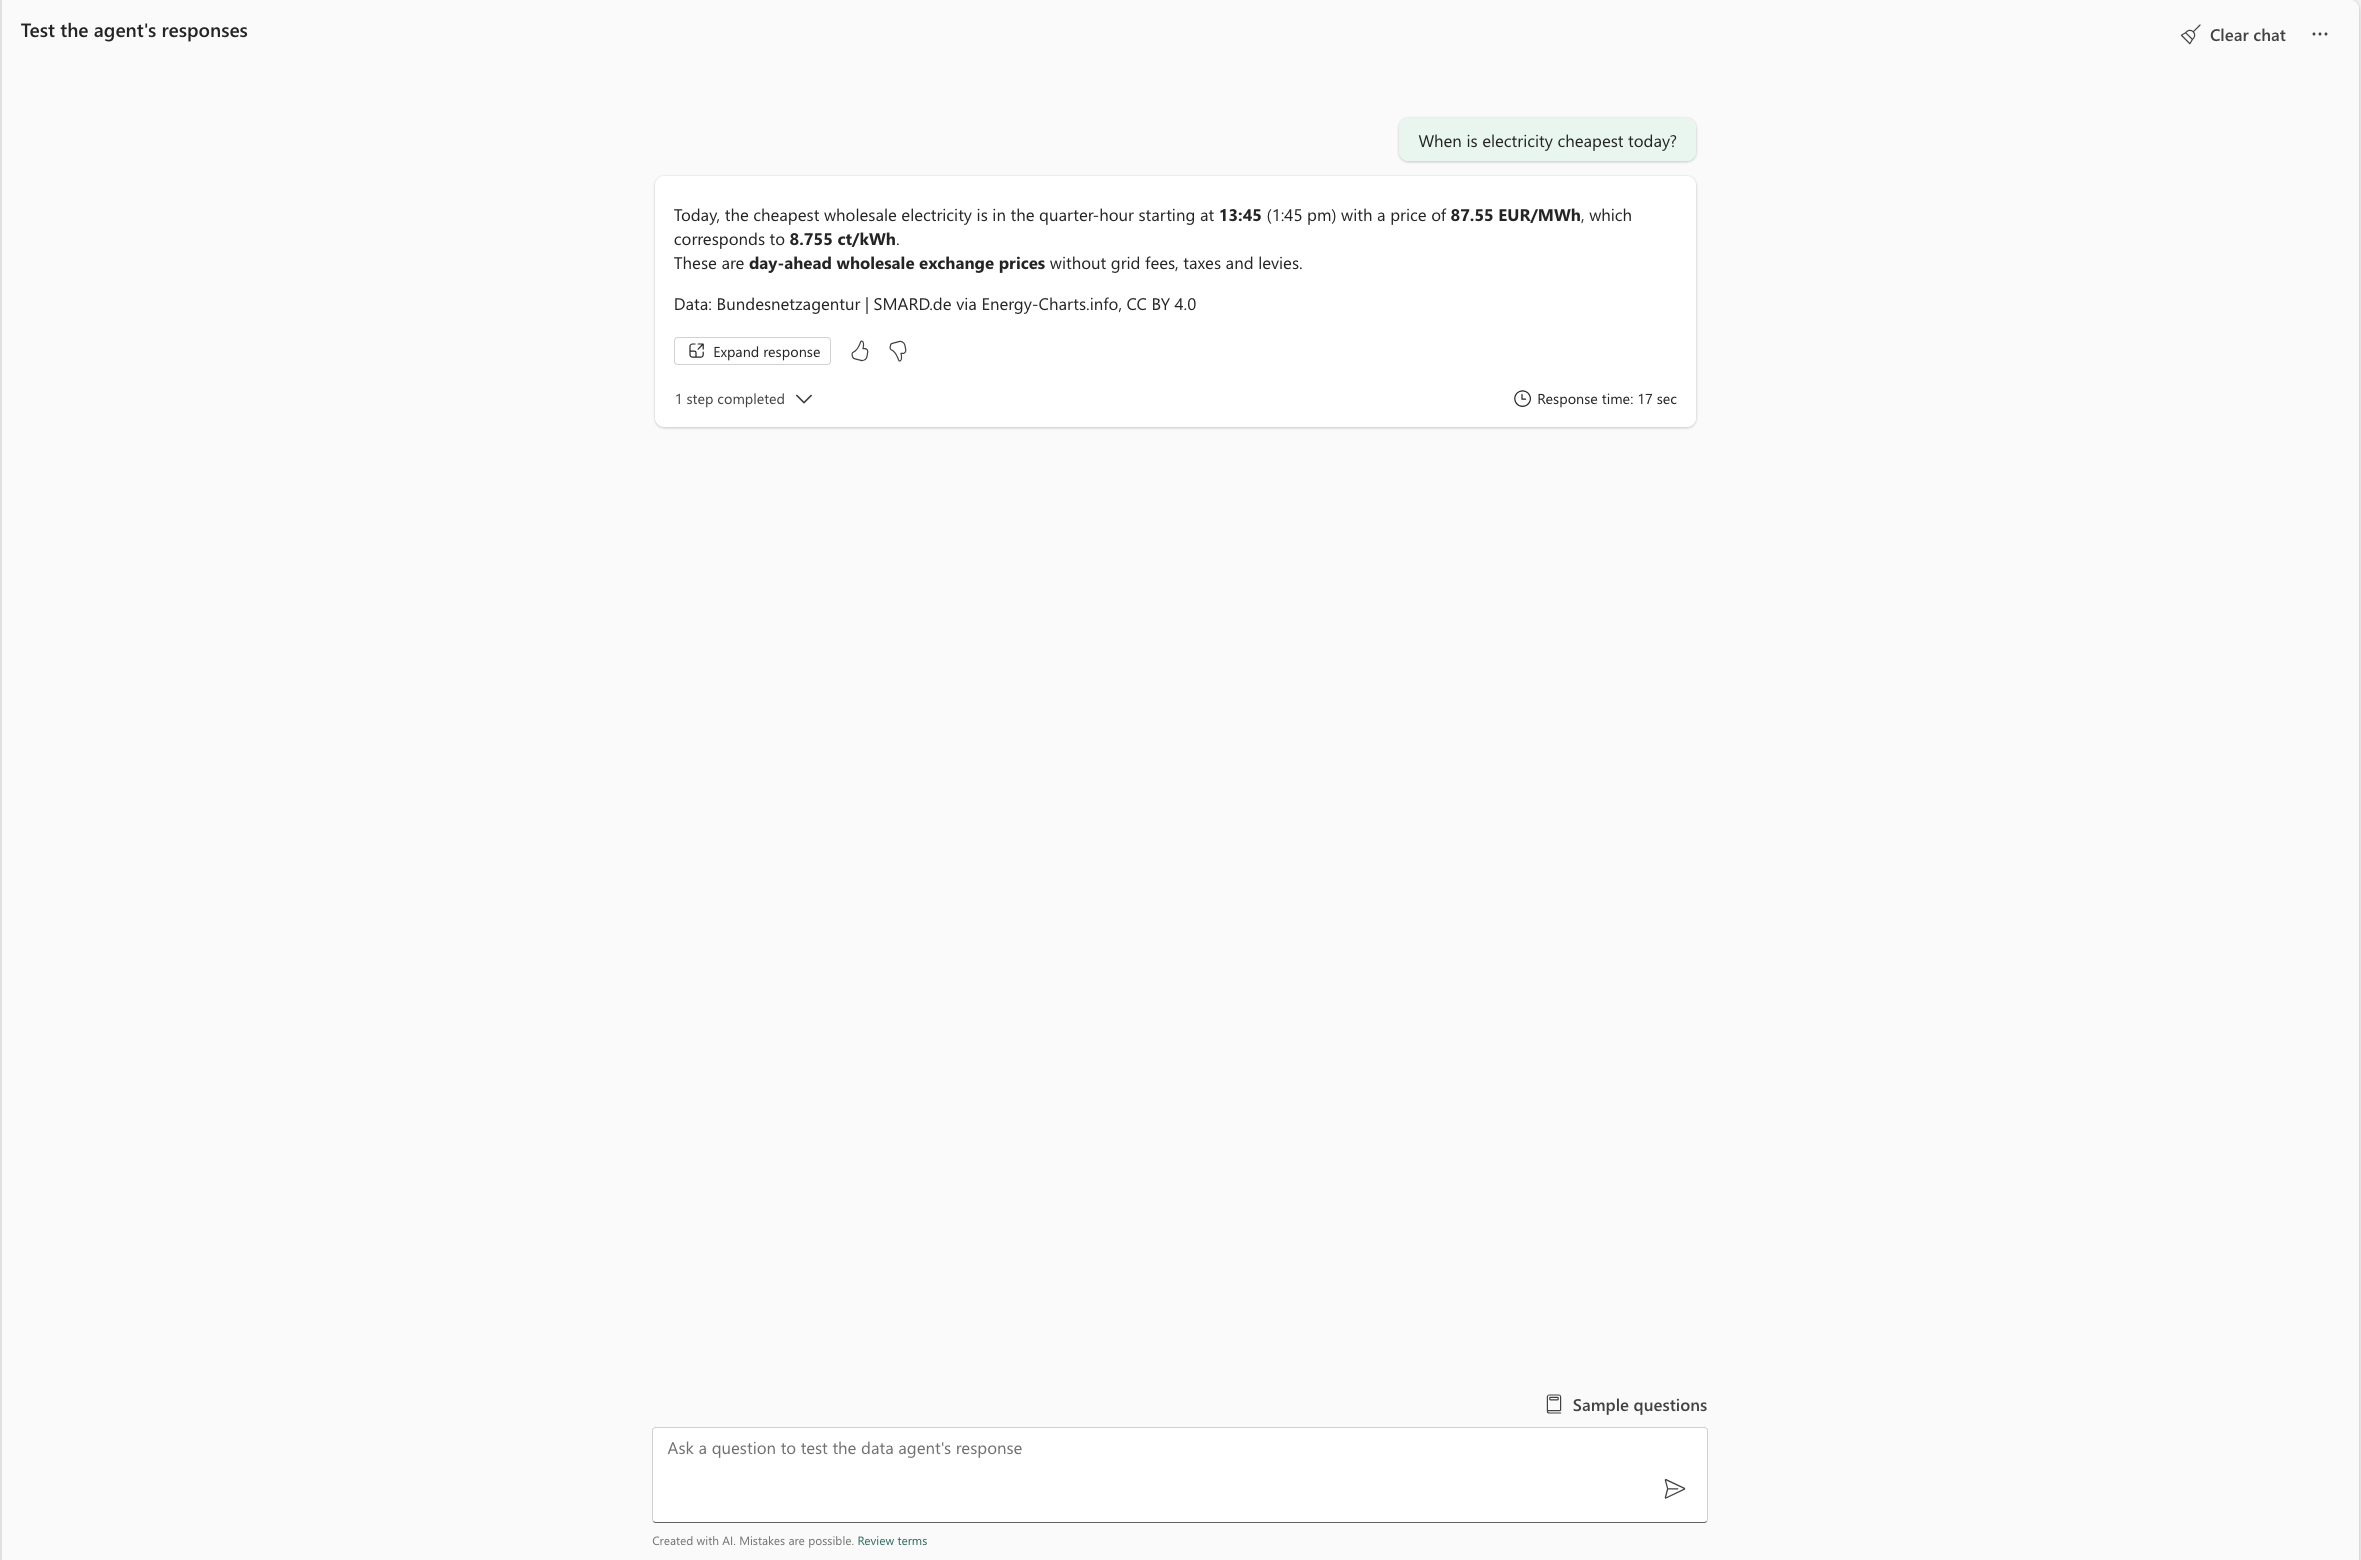
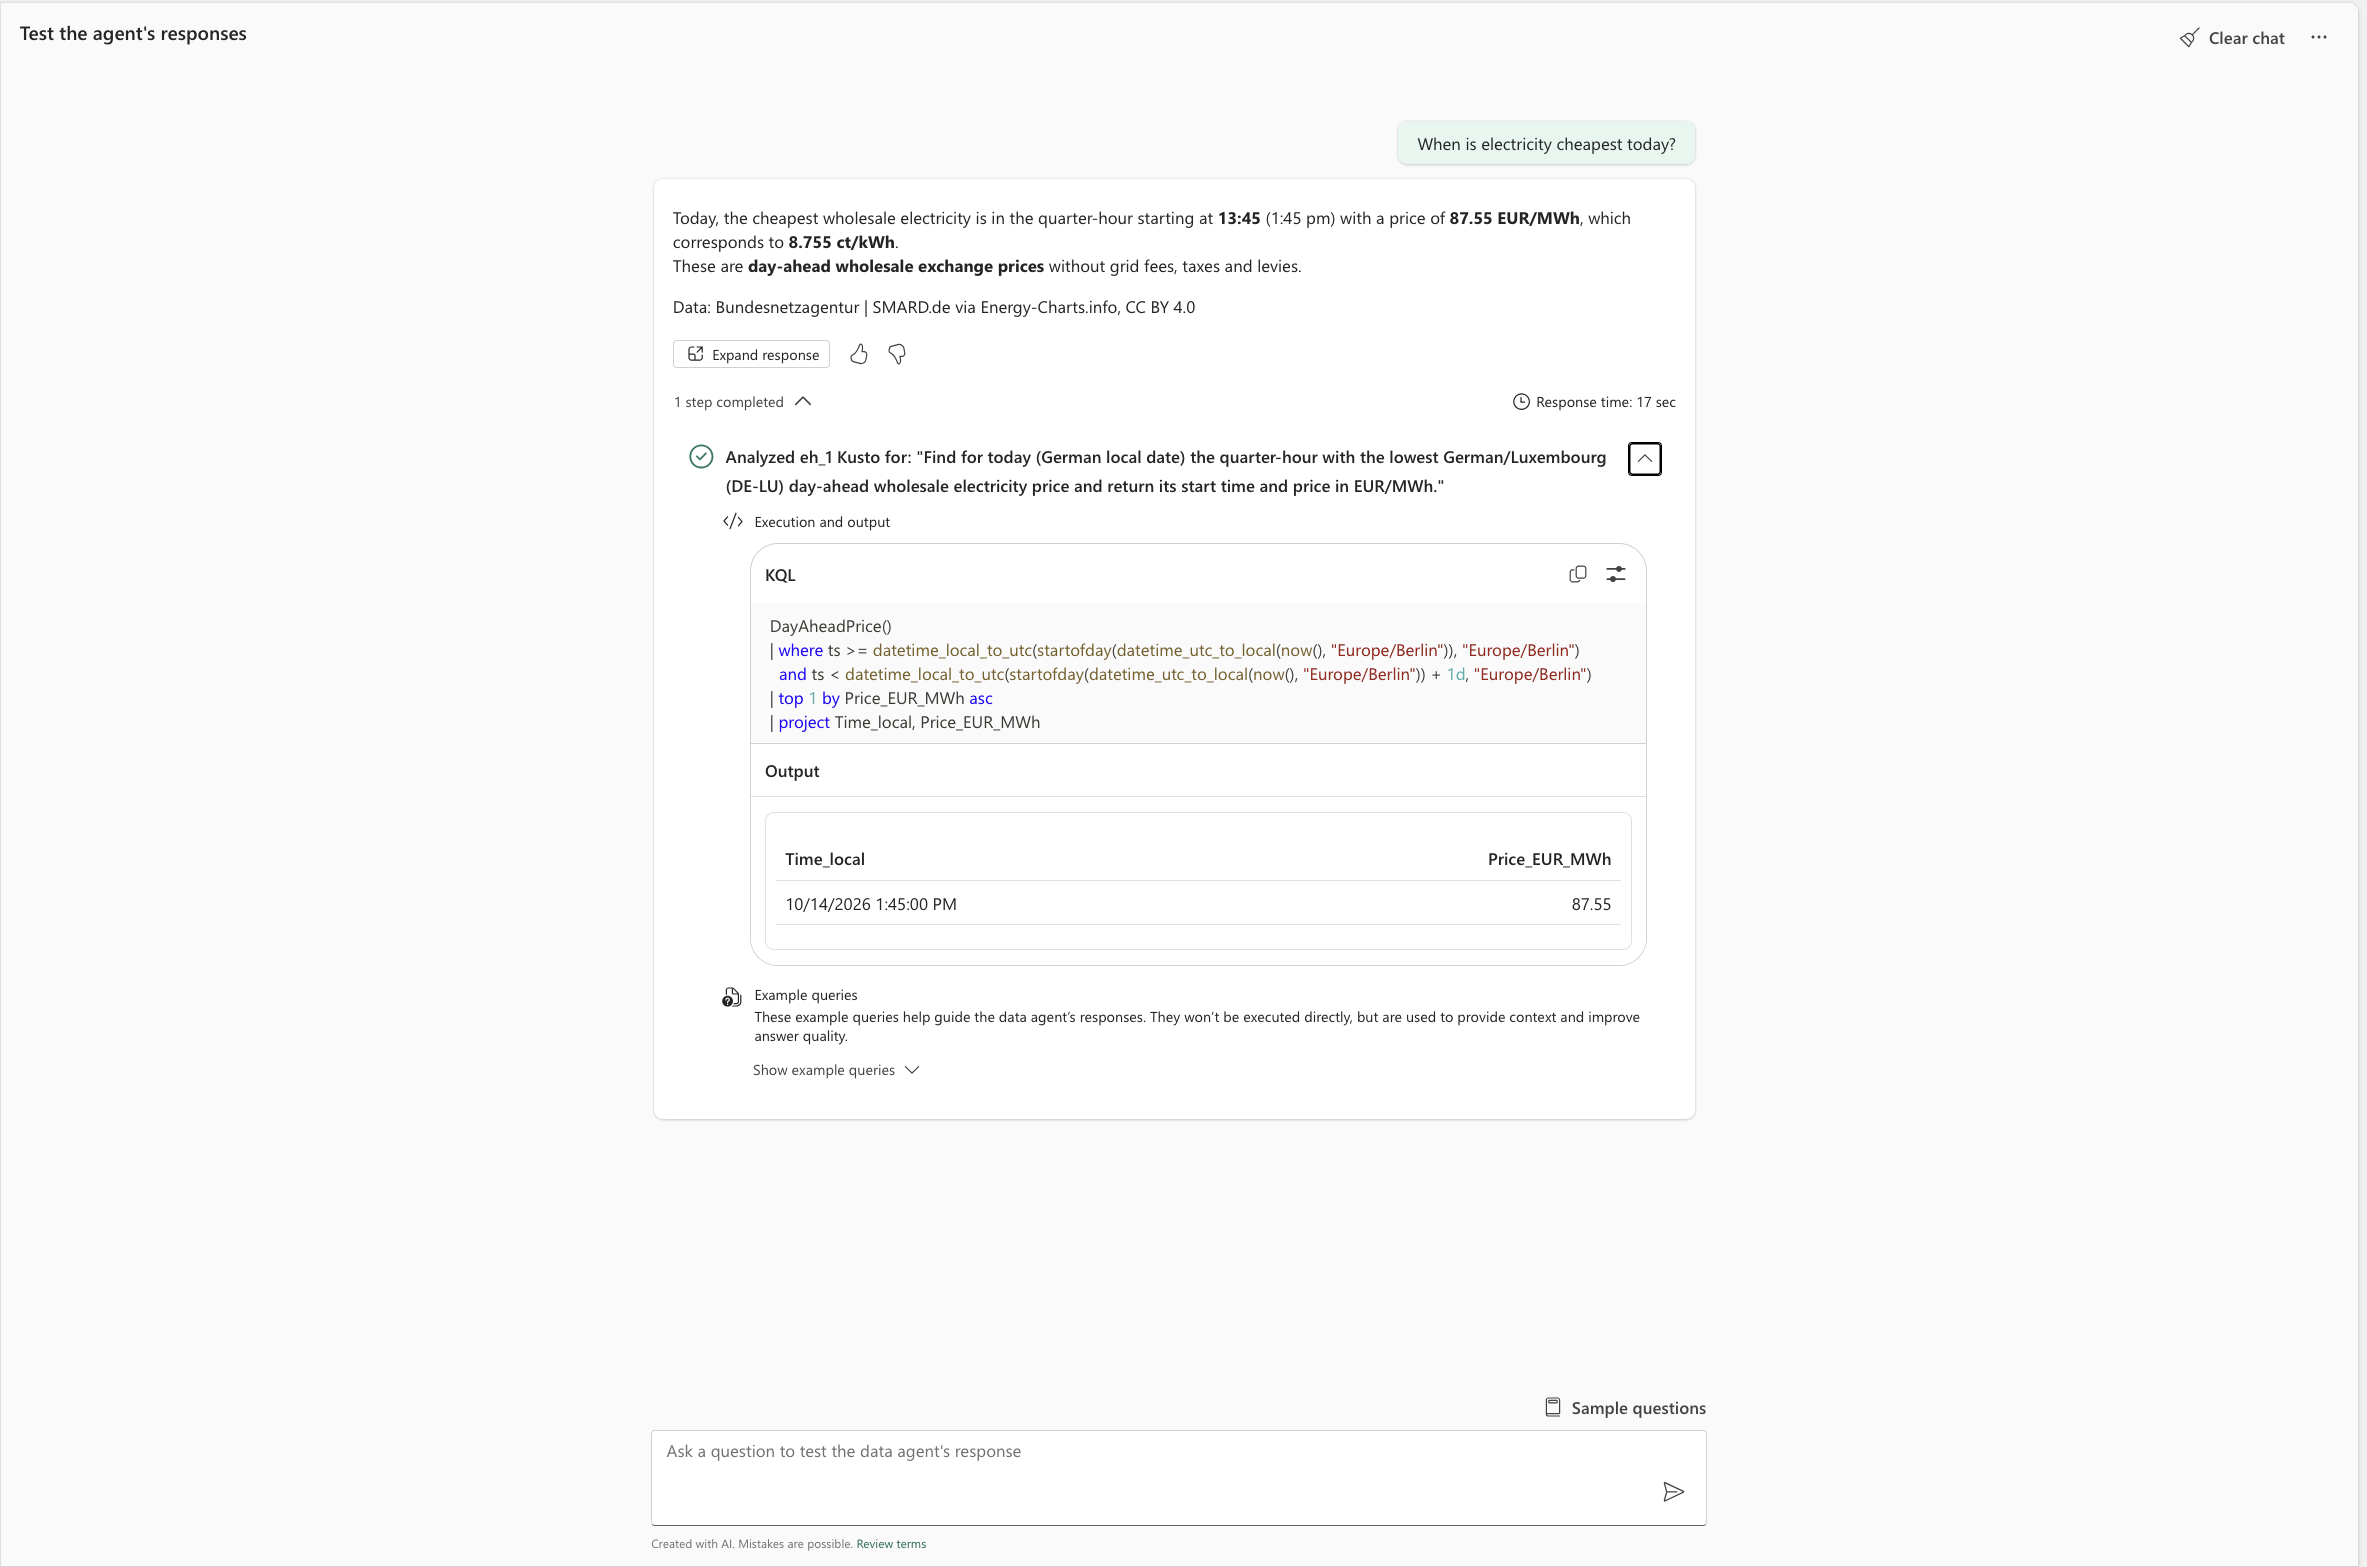
As a final step, I wanted to put an AI component on top. With a Fabric data agent, you can ask the Eventhouse questions in plain language, such as “When is electricity cheapest today?” or “How much solar power was generated yesterday?” The agent translates the question into a KQL query, runs it and explains the result. You can display the generated query, so every answer can be checked.
One thing up front: the data agent requires a paid Fabric capacity (F2 or higher). A trial capacity isn’t enough.
Setup
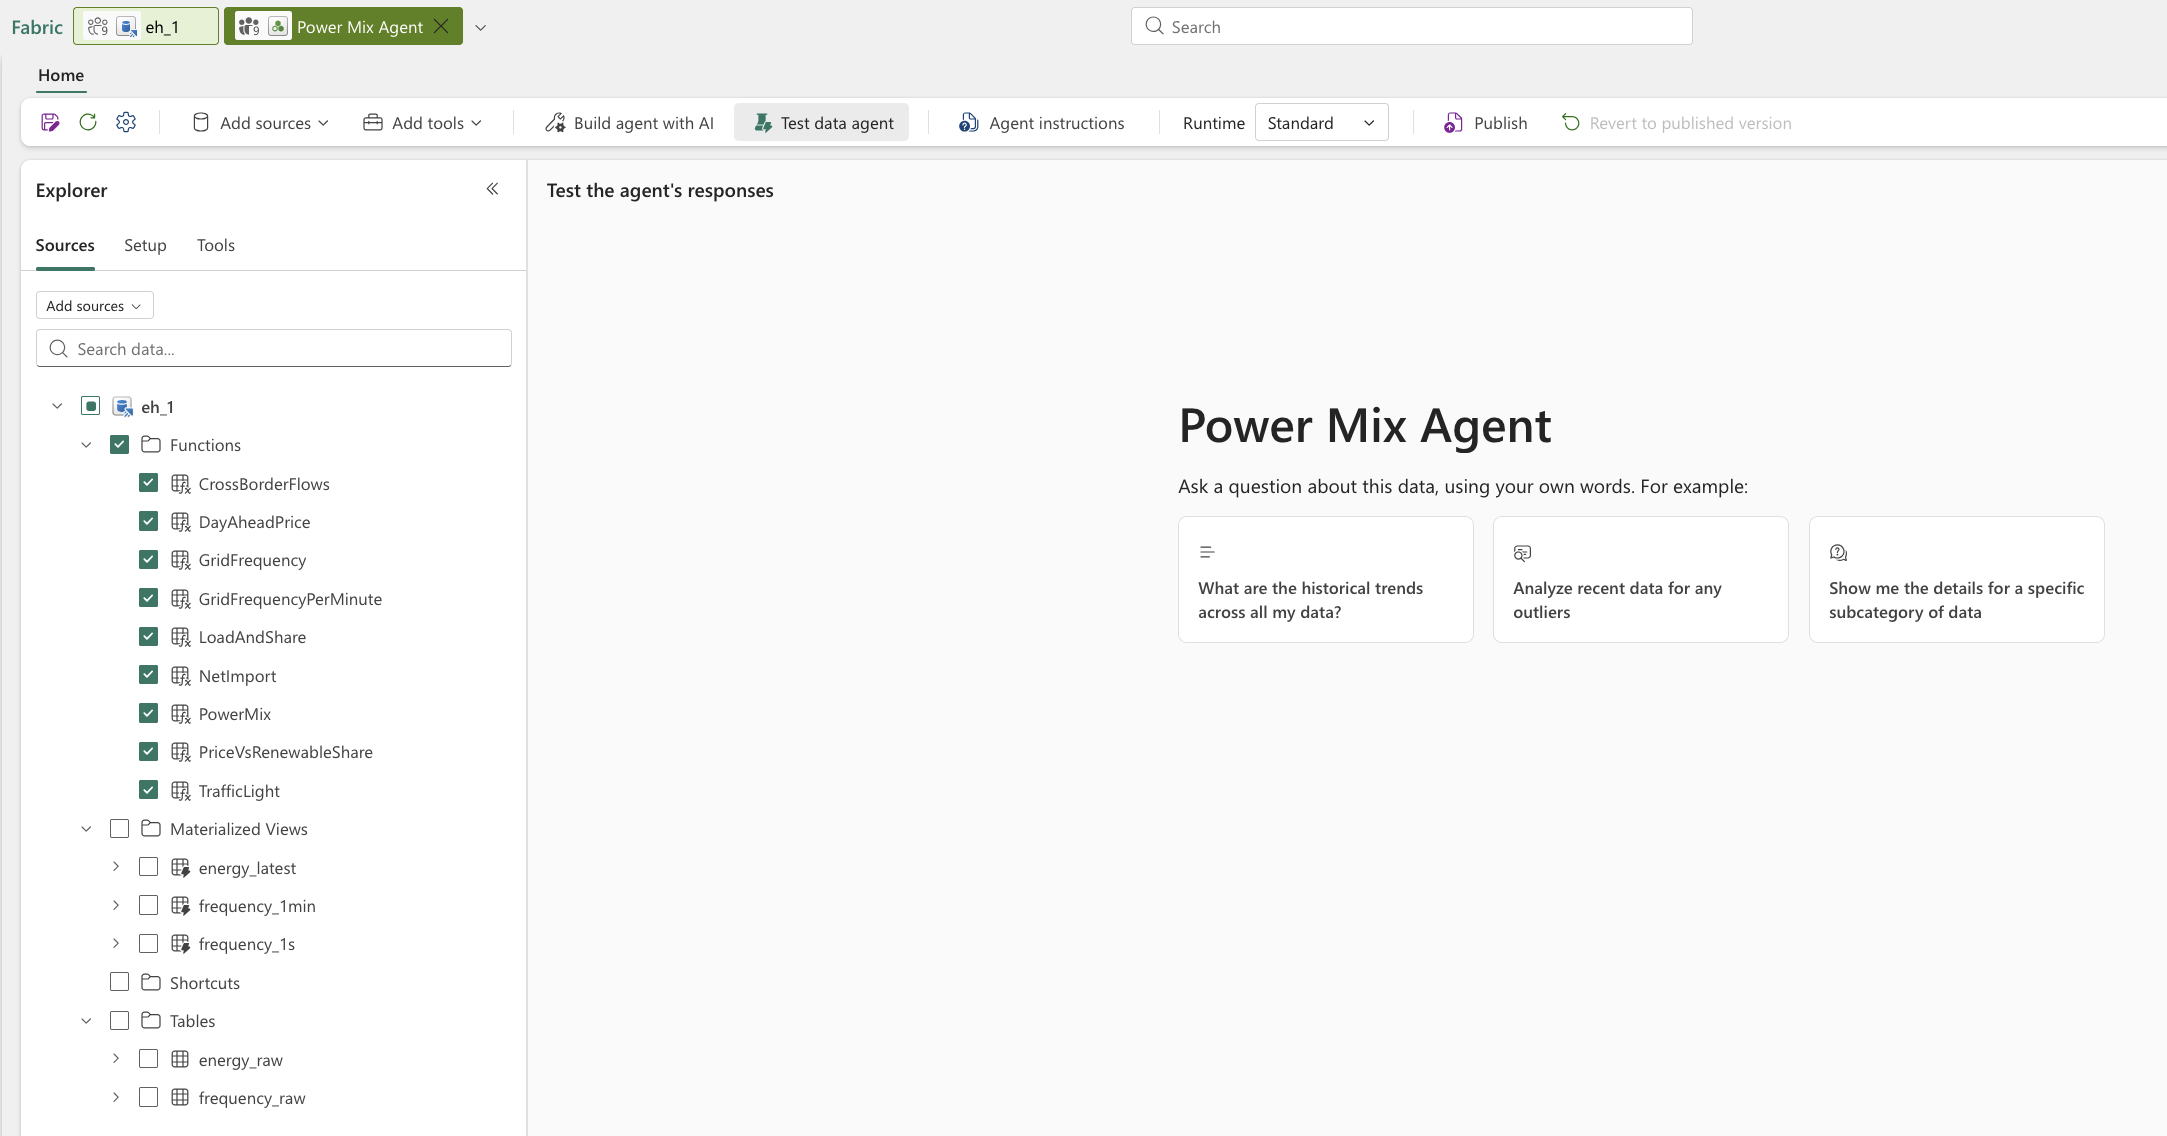
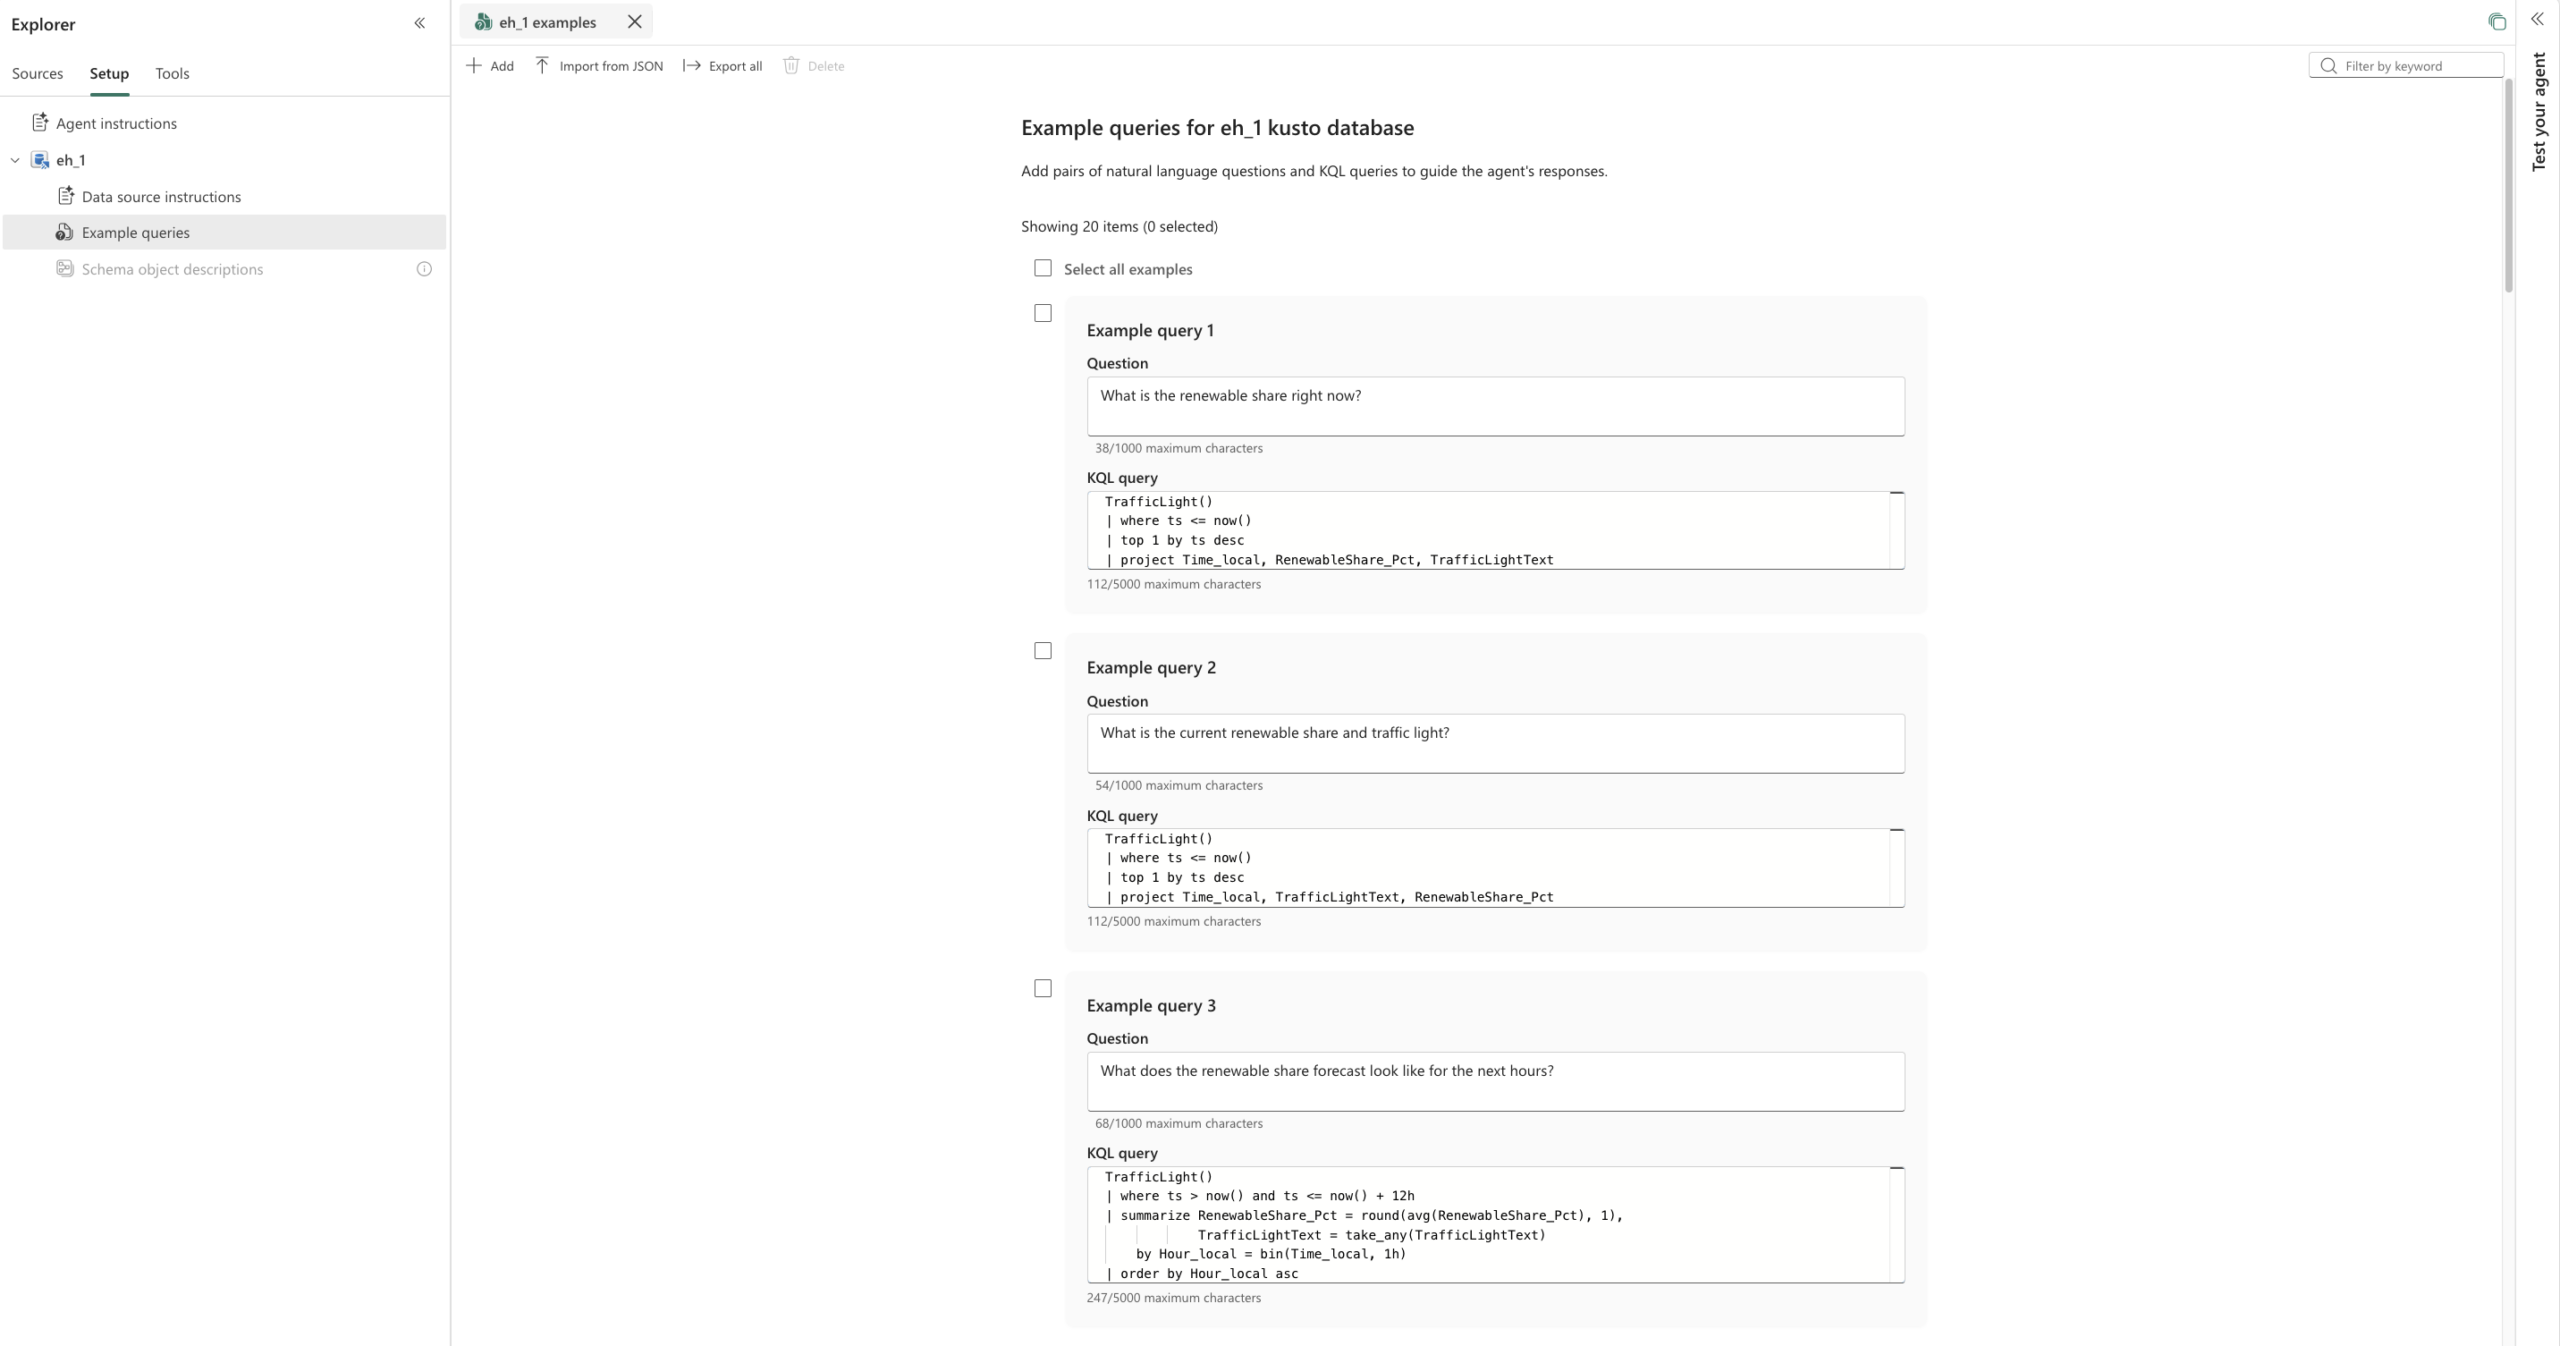
I connected the Eventhouse as the data source, but not with its tables, only with a set of my own KQL functions. They prepare the data so that the agent can understand it easily: with clear column names, units in the names and times in German time. On top of that, there are instructions for the agent and 20 example questions with matching queries.
What went wrong during testing
The first answers looked good, but they weren’t always right:
- For “now,” the agent picked a forecast value and showed the UTC time as German time. Since it can only see the functions and has clear rules for this, that no longer happens.
- For “this week,” it used a KQL function incorrectly and queried next week. An example query fixed that.
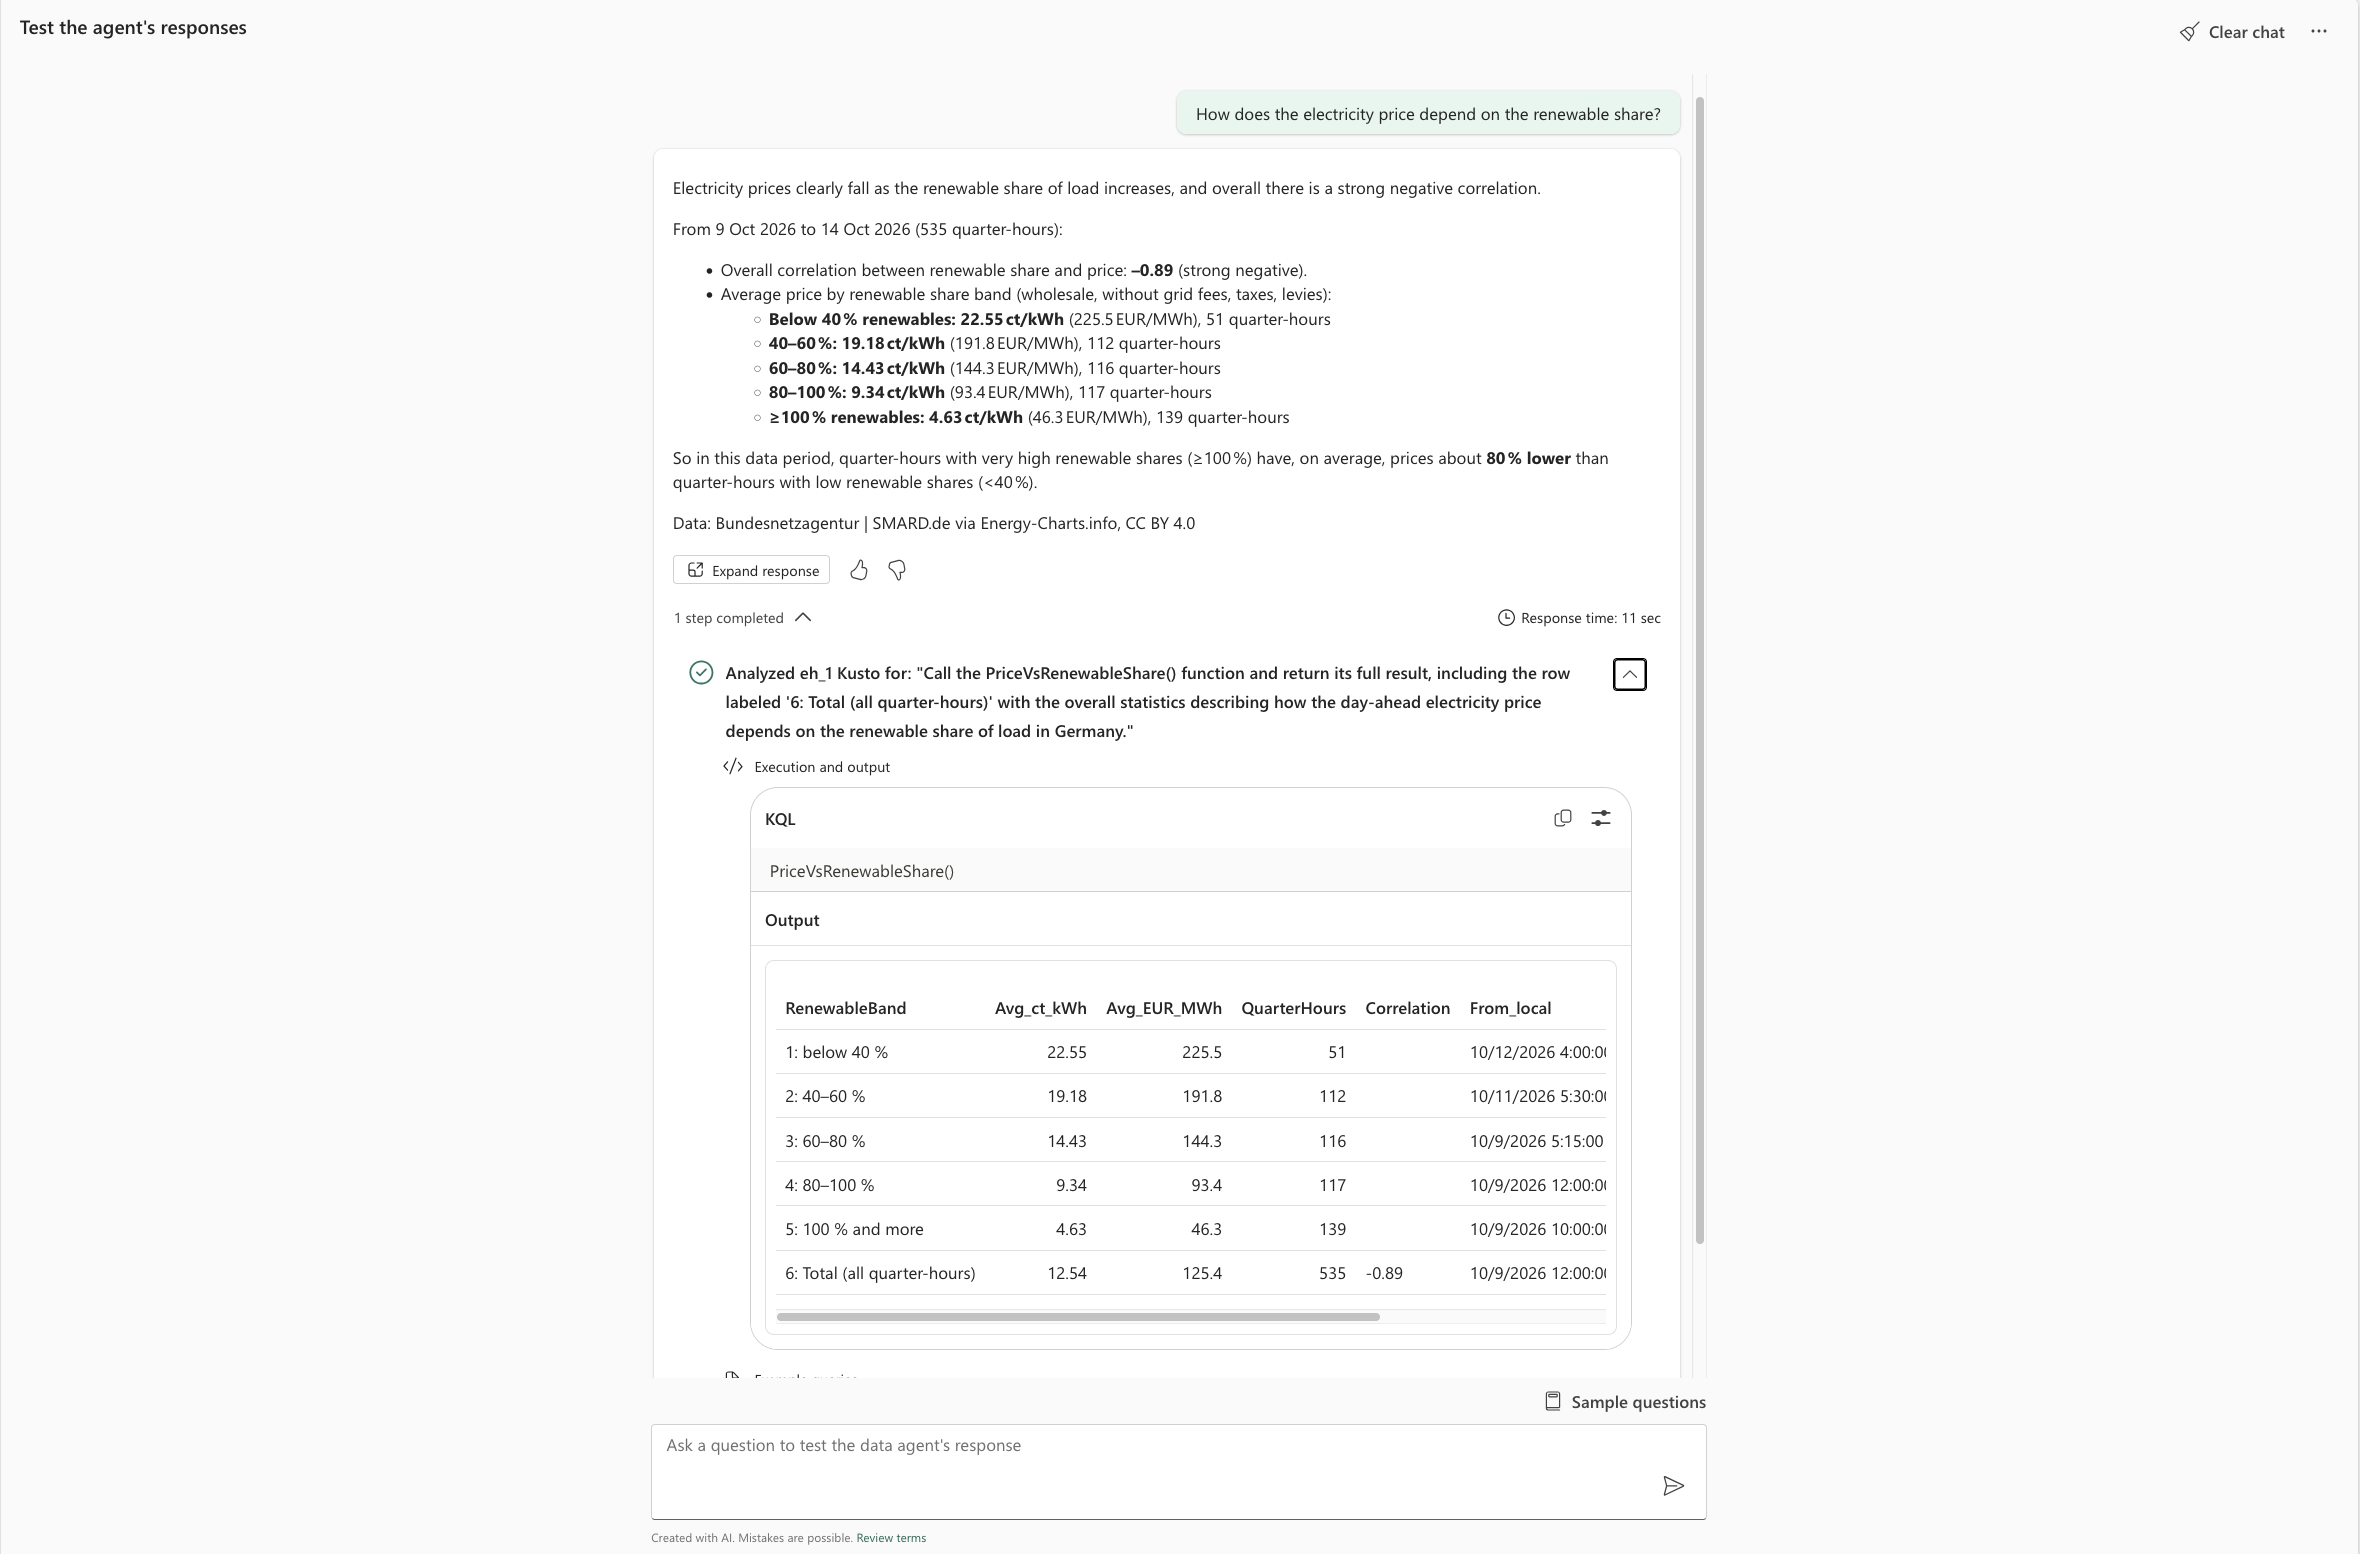
- For open questions like “How does the electricity price depend on the renewable share?” every attempt gave different numbers. Sometimes the agent analyzed only part of the data or combined averages incorrectly. The fix: a dedicated KQL function that always does this analysis the same way.
My main takeaway: the agent handles simple factual questions reliably. Recurring analyses with statistics, however, belong in a dedicated function. That way, the agent doesn’t calculate anything itself, it just retrieves the result.
Tip: the agent in Microsoft 365 Copilot
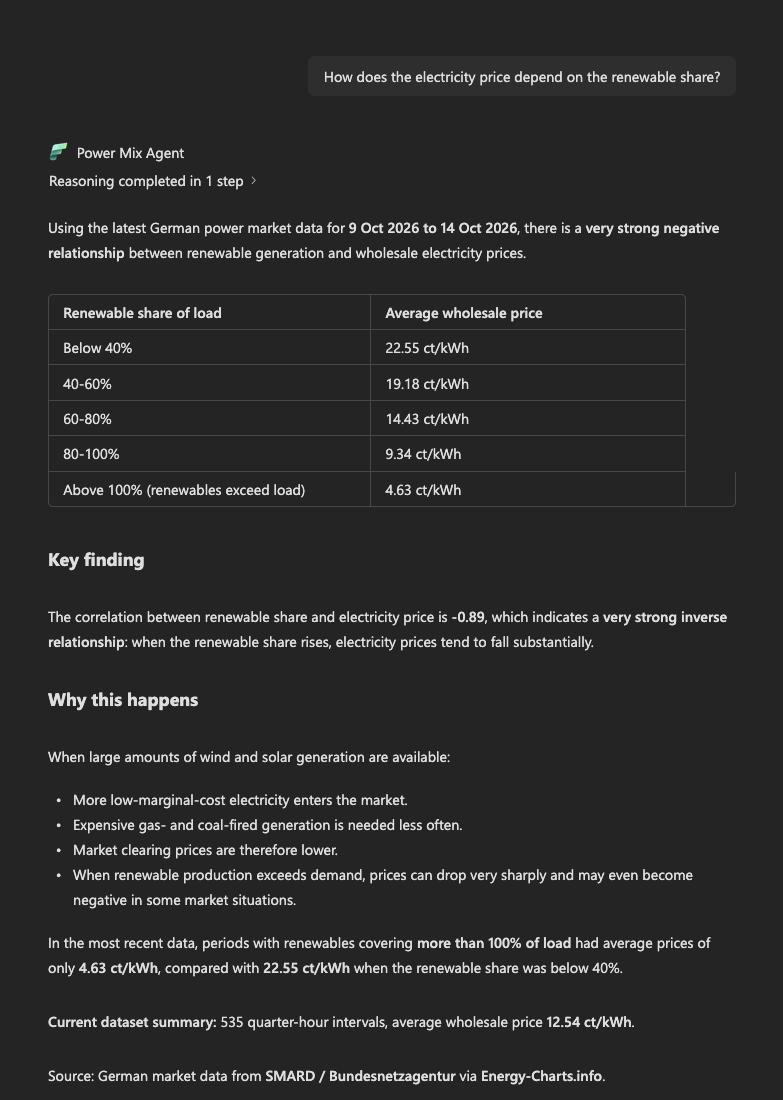
When publishing, you can also make the data agent available in Microsoft 365 Copilot. You can then ask questions about the power grid directly in Copilot chat. This requires additional licenses, typically a Microsoft 365 Copilot license. Copilot always uses the last published version, so you have to republish after every change. Copilot also rephrases the answers. In one test, it even added a statement that wasn’t true. Since then, the instructions say: only state facts from the query results.
For questions about specific values, Copilot uses the agent reliably. For “why” questions, it mixes the data with its own general knowledge. For exact numbers, the chat in Fabric is the more reliable choice, because it shows the generated KQL query.
Here are a few more screenshots of the agent in Fabric and in Copilot.
-
- The agent only sees the KQL functions, not the tables
-
- A question in plain language
-
- Every answer can be checked via the generated KQL query
-
- Example questions show the agent how to query
-
- Complex analyses run through a dedicated function
-
- The agent in Microsoft 365 Copilot chat
7. What I learned
1. Data sources aren’t perfect, and you have to plan for that.
Some values arrive one to three hours late, others get corrected afterwards, and while I was writing this article, the API was unavailable for almost an hour. Three things helped: only appending raw data and building the current version with a materialized view, a function that regularly reloads recent data, and an alert that tells me when no new data comes in.
2. Time zones are everywhere.
The data is stored in UTC, but it should be shown in German time. That affects almost every query, and also places you don’t think of: at first, the data agent showed UTC times as German time, and Activator emails display times with a “Z” even though they’re German time.
3. Getting started with Real-Time Intelligence is quick, the work is in the details.
Eventstream, Eventhouse and a first dashboard were up and running quickly. What took time were small things: a field that arrives as text instead of a Boolean, a tile that shows 3 MW as 0 GW, or values that only appear in an Activator email if you insert them in a specific way.
4. A data agent is only as good as what you give it.
Without preparation, the agent returned forecasts as current values and gave different numbers for the same question every time. It only became reliable with dedicated KQL functions, clear instructions and example questions. My tip: test the agent with questions you already know the answer to, and look at the generated KQL query.
5. Sort out capacity and licenses early.
The data agent requires a paid F capacity, and Microsoft 365 Copilot needs an additional Copilot license. It’s worth sorting out both before you start building the agent.
8. Conclusion
What started with the question of what Real-Time Intelligence can do in practice has turned into a small but complete system: data on the German power grid comes in every few minutes, the dashboard shows the current state, Activator lets me know about negative prices or an outage, and I can simply ask the data agent.
What surprised me most was how quickly the individual building blocks were in place and how well they work together. Most of what I learned came from the details: late data, time zones, and an agent that first has to be taught to stick to the data.
If you want to rebuild the project or try it with your own data, you’ll find the complete code, all KQL queries and the Fabric items in my GitHub repo: real-time-intelligence-project-energy
Data: Energy-Charts.info (Fraunhofer ISE) and Bundesnetzagentur | SMARD.de, license CC BY 4.0. The data was aggregated and converted.