Introduction
My last articles looked at Real-Time Intelligence from a wide angle: how data flows from an API all the way to a data agent, and what the whole thing actually costs in Fabric. This time I’m zooming in on something smaller that you deal with every day: the KQL query itself.
There’s no shortage of tips on KQL performance. Put the time filter first, use has instead of contains, don’t join too early, do the expensive work at ingestion instead of in every query. Microsoft’s best practices say the same. But one thing was always missing for me: how much does it actually help? Are we talking a few percent, or is there a world of difference between a bad query and a good one?
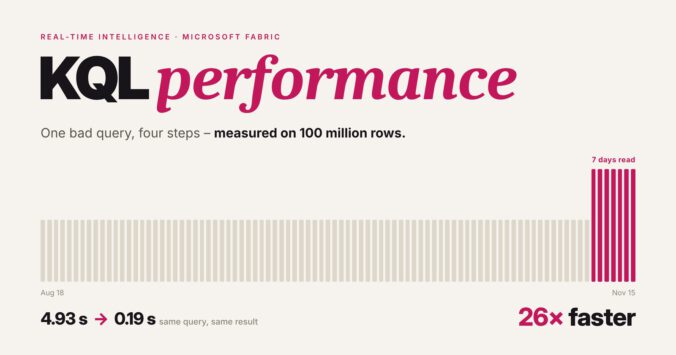
That’s what I wanted to find out. So I built a test dataset with 100 million events, wrote a query that gets pretty much everything wrong, and improved it step by step. I measured every step: duration, CPU, memory, and how much data was read.
Why does this matter if an Eventhouse is billed by uptime and not per query? Because slow queries still cost you something: dashboards that refresh sluggishly, users who have to wait, and capacity that’s missing for other workloads. Especially when lots of people look at a Real-Time Dashboard at the same time, every bad query shows.
By the end of this article, you’ll know which optimizations make the biggest difference, in what order to tackle them, and how to measure your own queries. You’ll find the notebook and all the queries in my GitHub repo, so you can rebuild the test yourself.